Stan Weinstein's Stage Analysis

Nice one ISA, I think Weinstein referred to these as "the glamour" stocks in the last Financial Sense interview.

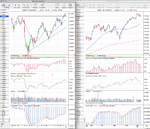
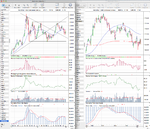
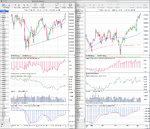
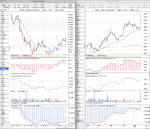
It's not unanimous then, having said that, you would expect the likes of JNJ and PFE to be the last to fall in a Dow theory bear market.

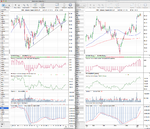
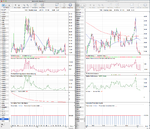
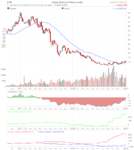
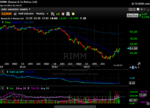
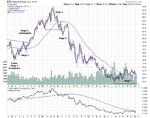
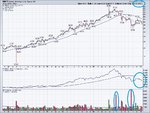
MSFT is in a well advanced stage 4 to the extent that it's encountering support from the previous stage 1 base!

EDIT: I thought I would share this article on volume from the creators of the McClellan Oscillator. As it's relative volume we look at I don't think we need to make any changes to the method but never the less I think it may be of interest to some here.
 
Last edited:
Re: Watchlist - UK

To continue on from my post earlier in the week, here's another bunch of monthly UK stock charts that are either making large Stage 1 bases or have moved into early Stage 2 on a monthly basis. These are for a watchlist for a potential pick for my ISA soon.
Building materials group Travis Perkins TPK looks OK Travis Perkins PLC, UK:TPK BigCharts.com
Avoiding the construction and property companies and fund management companies, investment bank Close Bros looks OK Close Brothers Group PLC, UK:CBG - BigCharts.com
Not for ISA, but gas storage project minnow Infrastrata could be fun InfraStrata PLC, UK:INFA - BigCharts.com

On question of volume, I heard Andy Brough, midcap manager of Schroders say he never bought or sold on exchange.
Likewise AXA IM's Thomas: 'Dark pools' are changing how we buy and sell
"I talked to my dealer the next day and said: 'Look at the London Stock Exchange volumes, there was only 20 million shares of BG traded yesterday, what was that all about?' And she told me: 'That 83 million were traded through BOAT'."
Thomas suggested such exchanges can often slip under investors' radar, pointing out he had not heard of the [Markit] BOAT exchange, despite the fact it accounts for 25% of the European volume in on- and off-exchange trading volumes.


The company would have to issue an RNS announcing Fund X now owns x%, but the chart stay the same. Sure enough, on the chart only 20m is showing. BG.L BG GROUP - Yahoo!
As for us, we just have to make do with what info we have, so I check the past few weeks' news reports, in case of any oddities. What else can we do?

One-third US is now off-exchange. I suppose they think: why be stitched by the HFTs and market-makers. A case of the modern world defeating itself, and a return to barter ?
 
Attached is the current major charts for your own stage analysis, and as normal I've updated the market breadth thread as well so that we can see what the weight of evidence is currently suggesting from the market internals here: http://www.trade2win.com/boards/technical-analysis/147476-market-breadth-23.html#post2052140

Below is the updated relative performance table in order of strength using the daily Mansfield RS reading.

attachment.php


The European stocks continue to lead the relative performance table and have broken their 2011 highs. The US stocks have began to catch up and the Russell 2000 smalls caps held above it's 2011 highs, but the NYSE chart is still testing the 2011 high, and the S&P 500 chart is also right at it's September 2012 swing high level. So resistance hasn't been cleared yet and the Nasdaq 100 still continues to underperform - mostly due to Apple's continued Stage 4 weakness. Which raises the question, can the US market make a prolonged breakout to new highs, while it's largest weighted stock moves lower?

I mentioned last week that the US Treasuries charts would be key, as they were at critical support levels. But they held, and rebounded modestly, and so if that continues in the coming week then stocks would come under pressure. As basically it's a battle between the Stage 3 ranges at the moment with the S&P 500 and US Treasuries in a tug of war to see who will break first. Equities have the upper hand currently, as Treasuries are at the bottom of their Stage 3 range, whereas the S&P 500 is at the top of it's Stage 3 range. So I think the 10 and 30 year US Treasuries charts are still the crucial charts to watch in the coming week as this tug of war continues.

I'm also going to be interested personally in the financials sector in the coming week, as it's one of the largest sectors, which has led the current rally and a large amount of financial stocks report earnings this week. Currently the sector is wildly bullish going into earnings, with 96.05% of financial stocks in the S&P 500 above their 150 day (30 week) MA. And 98.68% of financial stocks in the S&P 500 above their 50 day MA. So expectations are clearly very high that earnings will be good. So a definite warning flag to be aware of imo.
 

Attachments

  • SPX_Weekly_11_1_13.png
    SPX_Weekly_11_1_13.png
    150.5 KB · Views: 264
  • NDX_Weekly_11_1_13.png
    NDX_Weekly_11_1_13.png
    139.1 KB · Views: 262
  • IWM_Weekly_11_1_13.png
    IWM_Weekly_11_1_13.png
    129.1 KB · Views: 266
  • NYA_Weekly_11_1_13.png
    NYA_Weekly_11_1_13.png
    135.4 KB · Views: 305
  • DAX_Weekly_11_1_13.png
    DAX_Weekly_11_1_13.png
    138.2 KB · Views: 254
  • TY_10yr_Treasuries_11_1_13.png
    TY_10yr_Treasuries_11_1_13.png
    135.1 KB · Views: 282
  • CL_Weekly_11_1_13.png
    CL_Weekly_11_1_13.png
    138.9 KB · Views: 309
  • HG_Weekly_11_1_13.png
    HG_Weekly_11_1_13.png
    133.1 KB · Views: 322
  • GC_Weekly_11_1_13.png
    GC_Weekly_11_1_13.png
    131.8 KB · Views: 284
  • FTSE100_Weekly_11_1_13.png
    FTSE100_Weekly_11_1_13.png
    141.4 KB · Views: 311
  • US_30yr_Treasuries_11_1_13.png
    US_30yr_Treasuries_11_1_13.png
    135.2 KB · Views: 283
  • DX_Weekly_11_1_13.png
    DX_Weekly_11_1_13.png
    134.4 KB · Views: 334
  • VIX_Weekly_11_1_13.png
    VIX_Weekly_11_1_13.png
    130.3 KB · Views: 324
  • Major_Charts_RS_list_11_1_13.png
    Major_Charts_RS_list_11_1_13.png
    25.7 KB · Views: 982
Last edited:
US Industry Sectors

Attached is the updated US Industry Sector charts and the relative performance table. Health Care (XLV) was the sector of note as it broke out to new highs and is now another making a potential Stage 2 continuation move. Volume in the sector ETFs was notably weak also and was way below the 52 week average volume in the majority of the charts.

attachment.php
 

Attachments

  • US_Industry_Sectors_list_11_1_13.png
    US_Industry_Sectors_list_11_1_13.png
    20.8 KB · Views: 968
  • US_Industry_Sectors_D_11_1_13.png
    US_Industry_Sectors_D_11_1_13.png
    122.7 KB · Views: 298
  • US_Industry_Sectors_11_1_13.png
    US_Industry_Sectors_11_1_13.png
    125.1 KB · Views: 290
Attached is the charts for Alpha Natural Resources (ANR). I'm posting it because it's showing some interesting volume accumulation in it's current Stage 1 basing phase and seems to have been attracting some institutional buying from the effective volume data. As large players have clearly been accumulating since September.

It's relative performance has been improving and broke above the zero line on the daily chart briefly at the beginning of the year. The 30 week SMA has flattened out, and the 30 week WMA has turned up for the last 6 weeks after declining since the first week of May 2011. Price closed above the 200 day MA for the first time in a year and half a few weeks back and has traded slightly above it since. So ANR looks to be building a Stage 1 base with an initial Stage 2A breakout point above the 7th Jan swing high of 10.74 imo.

First resistance is around the 14 level and the swing target from the recent range would be around 14.32 and so the risk reward would be reasonable as it's 200 day ATR is 0.63 currently. So this would be an aggressive trader pick only if it makes a close above the recent swing high imo.
 

Attachments

  • ANR_weekly_11-1-13.png
    ANR_weekly_11-1-13.png
    115.6 KB · Views: 224
  • ANR_Weekly.png
    ANR_Weekly.png
    67.2 KB · Views: 268
  • ANR_pnf_11-1-13.png
    ANR_pnf_11-1-13.png
    23.9 KB · Views: 244
a few charts that are interesting me from the weekly basis..maynot be official weinstein, but have good imo stop plecement positions..
 

Attachments

  • arna.png
    arna.png
    69.3 KB · Views: 224
  • rimm.png
    rimm.png
    71.4 KB · Views: 243
  • epu.png
    epu.png
    75.5 KB · Views: 249
Last edited:
To visualize the discussion we've been having on volume recently, below is a 12 year chart showing the 40 week (200 day) moving average of the total volume on the major US exchanges - the NYSE, Nasdaq, and AMEX. What is clear is that for a number of years volumes on these exchanges have been in a steady decline following rising in the early 2000 period. The NYSE chart looks like a perfect example of the stages with a stage 2 advancing period, followed by a large stage 3 top and then the Stage 4 decline, which it's still in currently as it's pushing to new lows and back to the level it was at in 2000. Some of this may be explained by off exchange activity similar to what lplate highlighted in the article he posted the link to a few days ago. But is interesting to see and makes you wonder what the reasons are.

attachment.php
 

Attachments

  • sc-6.png
    sc-6.png
    22 KB · Views: 856
Last edited:
Just popped in quickly to give a heads up on GBP/JPY. Just gone into stage 2B, OH resistance about 22 months away so perhaps not so significant. Don't have volume or relative strength. Low risk entry ATM and it's pulling back for an even better entry. I noticed it as I'm already in using my own PA trading method for FX.

Will take a look at your volume post later ISA, can always guarantee good research from you.

Thanks goodtyneguy, I appreciate the kind words. Attached is a monthly and weekly chart of the GBPJPY for you with volume and relative performance so you can see it's Stages clearly in context with the other charts on here. It's been a low volume breakout so far with strong momentum. Weekly relative performance is above the zero line and the monthly is turning around after many years basing. Resistance is old, but remember FX is much more technically traded and so I'd give more weighting to it than I would if it was a stock personally. Monthly 30 WMA has turned up and cumulative volume is recovering and above it's own MA.

To do a sector comparison I suggest looking at the other JPY pairs like the EUR, AUD, USD etc, and doing relative comparisons and checking resistance on them all.
 

Attachments

  • GBPJPY_Weekly_15_1_13.png
    GBPJPY_Weekly_15_1_13.png
    131 KB · Views: 260
Thanks for the charts and commentary, you confirmed my thoughts about FX being more technically traded. I was calling this a 2B because of the break above the 140 previous high, is this correct.

As you can see GBP/JPY is very extended, I don't like to use o/b and o/s because I've seen how much of a misnomer this can be, especially when I was new to this game trying to pick tops and bottoms :rolleyes:

A consolidation whilst retesting the 140 level looks on the cards. My stop is at break even so nothing to lose here. Would a pullback to the 140 level be considered an entry point according to the method?

EDIT: Volume, one explanation may be a reduction in companies doing share splits and rights issues. On the latter perhaps with austerity and low interest rates companies have found it easier and cheaper to raise cash in the bond market. Also a lot of companies have been buying back shares instead of increasing dividends. This way they can maintains their dividend performance on decreasing profits. Does that make sense?
 
Last edited:
Iqe.l uk:iqe

Among the 52 week highs last week was £200m semicond company IQE
It b/o on vol 35p. Mkt likes acquisition of wireless component company Kopin.
It needs to hold above 35 for targets 45, 50, 55, 60 high.
This week is pullback week = takeprofits week for small investors.
With small cos you can see what needs to happen; over half shares are held by institutions, so ideal this week or next would be to see a move up with volume at least 3 million shares
Good example of to ignore side issue of chart shape, in this case the 1 year channel
IQE PLC - BigCharts.com
 
Thanks for the charts and commentary, you confirmed my thoughts about FX being more technically traded. I was calling this a 2B because of the break above the 140 previous high, is this correct.

As you can see GBP/JPY is very extended, I don't like to use o/b and o/s because I've seen how much of a misnomer this can be, especially when I was new to this game trying to pick tops and bottoms :rolleyes:

A consolidation whilst retesting the 140 level looks on the cards. My stop is at break even so nothing to lose here. Would a pullback to the 140 level be considered an entry point according to the method?

I would class it as in normal Stage 2 currently, as to date, since the Stage 2A breakout point, it hasn't had it's first significant pullback yet. You've identified the 140 level as it was longer term support and resistance as can be seen on the monthly chart and also the most recent continuation pivot point was created around that zone. But a pullback to that point wouldn't be considered an entry point according to the method imo, as the B entry point in Stage 2 is a significant pullback to test the Stage 2A breakout level which is a long way back from it's current level, but it could test it and not do any damage to the Stage 2 trend as the 30 week MA is still below 130 at this point.

So I'm assuming if you've already moved your stop to breakeven that you're not doing an investor play in GBPJPY, but a trader position, which requires a different approach. The 50 day SMA is your key moving average, as it should mostly stay above that, and stop losses should go a bit below the previous swing low which was at 139.37 from my data. The 200 day ATR is 0.93, and so it moves 93 pips a day on average and 298 pips a week using the 52 week ATR.

A trader entry point comes on the breakout above the swing high following a continuation pivot point (significant swing low) while in Stage 2 or a pullback to a recent swing low and reversal. But as the GBPJPY move has been fairly parabolic, it hasn't managed a pullback that was more than a single weeks average true range, and so imo there isn't a significant recent swing low as yet. However, the current pullback is more than an average weeks range and so if the 139.37 minor swing low holds and you get a new pivot point with a daily close above the previous days high and then it trades above that days high, then it could be possible entry point with a reasonable risk reward, but you need to wait for a swing low to form, as if it breaks the recent lows then it doesn't have much support until the 2A breakout point. So imo you need to wait for the first major pullback to take shape before considering an additional entry, which would need more than a single negative week.
 
Last edited:
Thanks for clarification ISA, it's helping me learn the new facets of the weinstein method and reinforce those I already know. I hope you're patient :)

I was using my own short term swing trading method but thought it an opportunity to see if my thinking was correct with regard to the A and B stage categories which are not discussed in the book, obviously it was not. My stop was a little tighter than you suggested but took me out at break even.

Started to read Weinstein's book again and would just like to remind everyone that we are in the second year of the presidential four year cycle (page 69). So if history repeats, it's a downward trajectory for the US SM's going into mid 2014.
 
a few charts that are interesting me from the weekly basis..maynot be official weinstein, but have good imo stop plecement positions..
Thanks blackmamba. I think I like RIMM best of those.

My US spots are techie IXIA $1.5 BN hit new 1yr and 2yr high on good results and needs to hold above $19. 2001 high was $30
XXIA 3yr StockCharts.com

A more classic stage pattern like RIMM is ENOC loss making $0.5 bn smart grid corp hit new high on news item which reduces its costs and needs to hold above $14.50. Previous important levels 20, 25, 35 ENOC 3yr StockCharts.com
 
Attached is the weekly and daily chart for Peabody Energy (BTU) which is currently trading in Stage 1. I'm posting it as I think it's a good example of the four stages and could be one for the watchlist in the coming months, as a break above resistance at 30 would give the potential for a move up to an initial 40.9 swing target from the Stage 1 base that's developing, and it's shown to be a big mover in both Stage 2 and Stage 4 in the past with 100%+ moves during those stages over a year or so timescale. See the monthly chart for a longer term view: BTU - SharpCharts Workbench - StockCharts.com

Relative performance versus the S&P 500 has been improving and there was a flush out volume week to hit the low followed by some decent volume accumulation up to the recent swing high at 29.84 - which has decreased during the current pullback around the 200 day MA. So this is an investor pick and as it's in Stage 1 the method says that you may begin accumulation.

For traders this would become more interesting on a breakout above the recent swing high of 27.74 - as it would move into Stage 1B, which is "Late in base-building phase. Watch for breakout." The current ATR(200) is 1.15 and the weekly ATR(52) is 2.75 and so it's a strong mover on a daily basis on average.
 

Attachments

  • BTU_weekly_17-1-13.png
    BTU_weekly_17-1-13.png
    31.4 KB · Views: 327
  • sc-10.png
    sc-10.png
    38.7 KB · Views: 333
  • SharpChartv05-3.png
    SharpChartv05-3.png
    33 KB · Views: 301
Last edited:
UK stocks for UK ISA

Home Retail £1bn with stores Argos and Homebase had good statement yesterday amidst the high street gloom. B/O this week at 135p with prev levels 195/235 technically, though such a large gain looks ambitious for a retailer.
UK:HOME 3yr BigCharts.com
 
Re: UK stocks for UK ISA

Home Retail £1bn with stores Argos and Homebase had good statement yesterday amidst the high street gloom. B/O this week at 135p with prev levels 195/235 technically, though such a large gain looks ambitious for a retailer.
UK:HOME 3yr BigCharts.com

I make the initial swing target from the summer Stage 1 base to be 137.35 - which it hit yesterday. But the bigger swing target from larger one year Stage 1 base to be 183.35 - which would be roughly a 35% move from the current levels. So not a huge move considering it's average daily range is 3.97 (2.9%) and there is no major resistance to that level. It's relative performance is good and has been above it's zero line since the October Stage 2 breakout. It's cleared near term resistance, but other than yesterday volume has been fairly lackluster. So it has some potential.
 

Attachments

  • HOME_weekly_17-1-13.png
    HOME_weekly_17-1-13.png
    118.5 KB · Views: 366
Last edited:
One of Rewardz's early picks US Steel is coming back to the break out level for an investors second opportunity to buy. Volume is far from ideal though. Any thoughts on this one please?

ISAtrader, I am perhaps looking to change my ISA broker, would you mind if I PM'd you on the subject?
 
Last edited:
One of Rewardz's early picks US Steel is coming back to the break out level for an investors second opportunity to buy. Volume is far from ideal though. Any thoughts on this one please?

The breakout has been fairly tepid so far on light volume and didn't even reach the previous strong volume resistance (as can be seen on the P&F chart) at 27. I think I said previously that I'd rate it a C grade pick, as it didn't have all of the necessary elements from the method as volume was too light and there was some strong near term resistance. And this seems to still be the case as the cumulative breakout volume was light, but the pullback volume has been light as well so it could just be a slow burner, as a lot of early Stage 2A breakouts are. Price support comes in fairly strongly at the 23 zone, and volume resistance is between 22-23 (as can be seen on the P&F chart again). The book isn't clear about the exact entry point for the B half position entry, just the pullback to the breakout level, and so you need to decide whether you should wait for a daily reversal around the breakout level or just buy close to breakout level without any confirmation of it reversing back higher again. My personal preference is to drop to the lower daily or 4 hour time frames and then wait for a decent reversal with some follow through on the next bar above the high of that bars high. But there's no set rule for it, I just prefer to wait for the reversal to begin in case the breakout support doesn't hold and it becomes a failed Stage 2 breakout and re-enters Stage 1. But this is one of the grey areas of the method.

P.S. I've created a new breadth indicator based on the amount of daily P&F breakouts and breakdowns in the Market Breadth thread if anyone's interested to add to our weight of evidence tools. http://www.trade2win.com/boards/technical-analysis/147476-market-breadth-24.html#post2056258

ISAtrader, I am perhaps looking to change my ISA broker, would you mind if I PM'd you on the subject?

Yep, no worries, send me a PM and I'll see if I can help.
 

Attachments

  • X_Weekly_18-1-13.png
    X_Weekly_18-1-13.png
    130.5 KB · Views: 329
  • X_PnF_18-1-13.png
    X_PnF_18-1-13.png
    18.9 KB · Views: 285
Last edited:
Monster Beverage ready to get smashed. MNST is turning into a stage 4 disaster as Stan likes to call them.

RS dropped off a cliff

High volume spikes on the distribution selloffs

30 week MA declining

Counter-trend rally back to the 30 week appears complete.

Side note, many deaths have occured over use of energy drinks and there are multiple pending legistlation proposals to ban sale of drinks to minors to as far as City of Chicago proposing a full blown city-wide ban of energy drinks in the city to EVERYONE of all ages.

Happy Trading (yeah I'm short) I've been listening to the charts...
 

Attachments

  • MNST - short idea.jpg
    MNST - short idea.jpg
    226.4 KB · Views: 330
Top