You are using an out of date browser. It may not display this or other websites correctly.
You should upgrade or use an alternative browser.
You should upgrade or use an alternative browser.
isatrader
Senior member
- Messages
- 2,965
- Likes
- 136
ISATRADER.....just curious if you have a watchlist of stage 4 stocks that have broken down that you are keeping in a watchlist for them to rally back near the 150 for breakdown shorting candidates?
My focus has been more broad lately away from individual stocks and I've only been trading in the major Indexes, US treasuries and Commodities for the last few months. For example I was short the S&P 500 last week, but closed out half my position after hours on Friday and then the rest on the futures market open on Sunday night after I completed my weekend stage analysis charts and market breadth summary. I then went long Gold early today before the US pit trading began with half a position and that's all I've got open currently. So I'm keeping it fairly basic at the moment, especially as I'm going on holiday on Thursday morning to Koh Samui in Thailand for a well earned break. So I won't be able to do any updates on here until I'm back in the UK in early December. But I know lplate is still around and he looks at the individual stocks every day, so maybe he may be able to make some suggestions for you?
Last edited:
isatrader
Senior member
- Messages
- 2,965
- Likes
- 136
ISATRADER.....just curious if you have a watchlist of stage 4 stocks that have broken down that you are keeping in a watchlist for them to rally back near the 150 for breakdown shorting candidates?
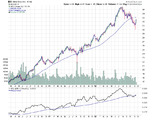
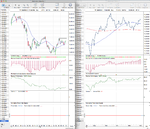
Here's a couple of Stage 4 stocks that might be worth looking at shorting on a pullback to resistance: American Express (AXP), Cirrus Logic (CRUS), Altria Group (MO), Omnicom Group (OMC). Look at their patterns and you should be able to find more stocks or ETFs making similar early Stage 4 moves.
Attachments
. . .
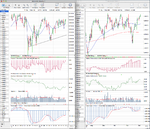
The stock indexes traded down heavily last week and moved us into Stage 4 according to Weinstein in his interview this weekend. . . .
The S&P 500 finished the week right below it's 200 day MA and on a major one year trend line of which this is the third test, and so it could also possibly bounce around here to retest the breakdown around the 1400 level. So if you are not already short stocks or long treasuries from the breakdown/breakout levels then I'd personally suggest standing aside until you get a better risk reward opportunity, as a short trading stop loss on the S&P 500 would go around 1443.85 imo, and so you need a pullback to around 1400 to consider getting in with an acceptable 2.96 x ATR(200) risk.
The S&P 500 formed a small head and shoulders Stage 3 range over the last 3 months which gives us a swing target to 1318.61 imo from that range. I personally had considered it in Stage 2B- as I thought the range was too small for Stage 3, and broke down very quickly once it was below the 50 day MA. But it's Weinstein's method after all, so I bow to his superior knowledge. It does however give me further questions about defining the precise entry points for Stage 3 and Stage 4 as from the multiple examples we've been through on here the Stage 4A breakdown point is generally not until price forms a swing low below the 200 day MA and then breaks below that. Obviously, that hasn't happened in this case as the entire Stage 3 range developed above the 30 week SMA and he declared Stage 4 with a close below that and the 30 week SMA. So I need to delve back into the book and chart examples to clarify the Stage 4 breakdown point as I'm obviously being too conservative by waiting until the swing low below the 200 day MA to declare it and should just be looking for a breakdown from a consolidation range that then closes a week below the 30 week SMA. . . .
With the SPX bouncing up to close the week at 1409 and so above the 30 week MA, you see how this dilemma discussed so well by isatrader is compounded.
Tech is underperforming and the rally is on low volume, so shorting still looks a probability, but, before having a general disposition to go short, we nevertheless need to have it confirmed that this is a false rally, I think.
It looks to me that Weinstein chose his Stage 4 on the basis of a break of the 1-year uptrend line.
If that trendline is valid, then I suppose by the textbook we should look for a retest from below, which might be around the 1415/1420 area.
$SPX - 2 yr 30wk SMA- StockCharts.com
With the SPX bouncing up to close the week at 1409 and so above the 30 week MA, you see how this dilemma discussed so well by isatrader is compounded.
Tech is underperforming and the rally is on low volume, so shorting still looks a probability, but, before having a general disposition to go short, we nevertheless need to have it confirmed that this is a false rally, I think.
It looks to me that Weinstein chose his Stage 4 on the basis of a break of the 1-year uptrend line.
If that trendline is valid, then I suppose by the textbook we should look for a retest from below, which might be around the 1415/1420 area.
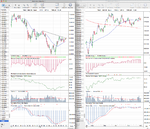
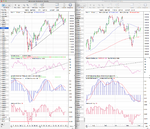
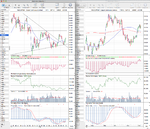
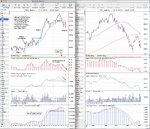
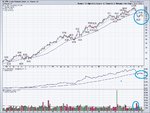
I personally agree with your assessment of the trendline being broken and that being a deciding factor for Weinstein himself. However, what I understood from the interview was that he thought the "glamour stocks" such as AAPL and LNKD are in their own stage 4 patterns and are the leaders of the market both on the upside and the downside (especially apple). see attached chart

I think it is a time to wait for this "bounce" to be proven false like you both caution but I still see a downward trending 30 week weighted moving average as well as the stock price currently residing underneath it. After all, he did say that this bounce would occur and was still advising caution.
On another note, I have been seeing an awful lot of stage 3 tops and the beginnings of stage 4 declines. I have posted some of the better looking ones ie the ones that have had steep Stage 2 advances with only small amounts of congestion areas along the way. Let me know what you guys think as I'm not always sure about my "neckline" placement...For all charts, the blue MA is a for the weekly charts while the magenta is for the daily..both are weighted moving averages.
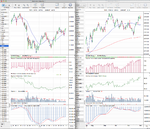
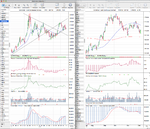
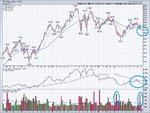
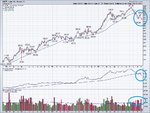
Bed Bath and Beyond (BBBY) Has had a great 4 year Stage 2 run and looks to have entered Stage 3 at the midpoint of 2012. The RS to SNP has been trending down since that time. IMO, it broke down into Stage 4 as it fell below 60 bucks or so and has just now bounced back to that price for the 2nd entry point. It hit and is now trending down again. Sorry about the daily trendline but you can see where it should be...


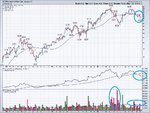
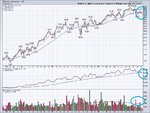
Whole Foods Market (WFM) Is another great success story in the states going for an impressive Stage 2 run since Nov 08. It is on my radar because its MA has flattened out and begun (barely) to trend down. I believe if it doesn't hit a new high in the next few weeks, it could be destined for a Stage 4 decline. WFM as well as BBBY seem to be very trendy in the states. Not sure if that makes them "glamour stocks" in the mind of Mr. Weinstein but they have had similar runs in terms of time compared to AAPL.


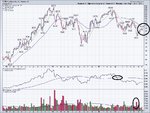
Another industry that I feel has potential for loss is the travel industry. Charts like Priceline (PCLN) and Wyndham Worldwide Corp. (WYN) both look really nasty to me. No time today but another industry is housing which seems to have a lot of charts moving into the Stage 3 area. I like housing on the short side because it had such an impressive run up but definitely need to see some more charts in 3-4 range to make any decisions. Any and all feedback on my thinking would be very much appreciated.


isatrader
Senior member
- Messages
- 2,965
- Likes
- 136
I see you had a good discussion while I away on holiday for Weinstein's reasons for calling that the broad market was moving into Stage 4A. A friend of mine contacted Weinstein following the recent interview and got some clarification of why he was calling the move to early Stage 4A. He said that all of the popular averages were below their 200 day moving averages and that his proprietary S&P and Secondary Survey's which measure the percentage of stocks that are technically healthy in Stages 1 & 2 had fallen below 50% - which means that there were now more stocks in the bearish Stages 3 & 4 than in the bullish Stages of 1 & 2. So hence the Stage 4A (early in the declining phase) call for the broad market. Importantly, he went on the say you shouldn't worry if it's Stage 3B (late in the topping phase) or Stage 4A etc, as it's far more important to understand that it is a time to be defensive.
Weinstein has said in recent commentary that the entire market is not yet negative, with a number of stocks that are still bullish, and he emphasised strongly that not every stock is bearish at this point. However, this is apparently the way it has happened before historically in the early stages of a new bear market and that he has many reasons for the call, but the most important one, is that all of the popular stock indices have moved below their 200 moving averages. The emphasis being placed on the all part of that sentence. The indices that he is talking about here are:
Dow Jones Industrial Average (DJI)
S&P 500 (SPX)
Nasdaq Composite (COMP)
Nasdaq 100 (NDX)
Russell 2000 (RUT)
His proprietary S&P and Secondary Surveys are the next part of the call as they peaked in mid September and deteriorated rapidly to below their 50% levels in early November causing the market to become increasingly short term oversold. He placed a strong emphasis on the fact that the short term should only be considered as a "2" on the Richter Scale, whereas the longer term action should be thought of as a "10" on the Richter Scale and hence the various signs don't bode well for the coming months. So this once again highlights what I've said before on the thread that Weinstein's method is mostly a longer term method and that he considers short term moves much less important.
So this has given us a slightly different clarification of how to determine when the market is moving from a neutral Stage 3 to a bearish Stage 4 phase and that is: "if, at any point, all of the popular stock averages break down below their respective 200 day moving averages - and this happens in concert with both the S&P and Secondary Surveys breaking below their respective 50% levels - then a troublesome market will become much more of a problem, and the long term pattern will move from a neutral but weakening position to a bearish rating."
Now the problem retail traders like us have with that statement is that we are unable to access the data for his proprietary S&P and Secondary Surveys which measure the percentage of stocks that are technically healthy in Stages 1 & 2 without a $10,000 subscription to the GTA newsletter. And I'm fairly certain no one on this site is likely to be able to do, that as you'd need a $1million account size minimum to make that worthwhile - i.e. 1% fee per year, and even that would be too much imo as you need to minimise your annual trading costs well below that, and you need to include data costs and all other trading costs in that as well, as all of those costs are your business overheads and give you your break-even point each year before you make any profit from your trading. Trading is a business after all, and so you should treat it as such.
Anyway, back to the point I was making in that the S&P and Secondary Surveys are not available to us…you can however, use the next best thing which is the "Percentage of stocks above their 30 week (150 day) moving averages ($NYA150R)" which is available for free on Stockcharts site or in my Market Breadth thread which I update regularly. This and the Percentage of stocks above their 10 week (50 day) moving averages ($NYA50R) are referenced in the GTA reports as key indicators to follow and do basically the same thing as his S&P and Secondary Surveys in that the vast majority of stocks above their 30 week MAs will be in Stages 1 or 2, and so you can use it as a reasonable substitution for the proprietary surveys.
I see from the discussion while I was away that you both thought that the one year trendline break was the cause of the Stage 4A call. However, from listening to the interview and talking to my friend that was given a few recent weekly GTA updates following his email to Weinstein, it's clear that the "Weight of Evidence" approach that Weinstein references regularly which involves numerous breadth indicators, such as the Advance Decline Line, Advance Decline Momentum Indictor, Glamour Average, Speculation Index (weekly OTC volume/weekly NYSE volume), Buy/Sell ratio, 10 day High-Low Differential gauges, New High New Lows, Call/Put Ratio, NYSE 10 day Advance-Decline moving average, Investors Intelligence survey of the percentage of bullish market advisors, Large Block Ratio, Investors Intelligence Overbought/Oversold Oscillator (the percentage of stocks on the New York Exchange that are above their respective 10 week moving averages), Eleven O’Clock Indicator, New Offerings gauge (a 10 week moving total), Net Free Reserves gauge, Insiders Sell/Buy Ratio, Mutual Fund Cash Ratio, Bank Cash Ratio, Alert Indicator (AAA Bond Yields/3 Month T-Bill rates), as well as his proprietary S&P and Secondary Surveys are all part of the reason for his call and that although major trend lines are important there's much more depth to this method, as you need to consider the various internals along with the price action to determine the correct Stages, as Weinstein says that several decades ago, they devised their “Weight of the Evidence” approach, and that they always listen to what the majority of their time-tested indicators are saying. So I'd expand on that, that this time although the S&P 500 market stage appeared to be only moving into Stage 3 when Weinstein called 4A for the broad market, the additional weight of evidence from the breadth gauges and the fact that all of the popular stock indices have moved below their 200 moving averages is indicating that it is a much more serious longer term problem and hence it is a time to be defensive, even though we can still have very strong short term rallies like we've had the last few weeks. Remember the Richter Scale reference - the short term is considered a "2" and the longer term is considered a "10" with Weinsteins method.
Last edited:
Good point isa- he does say in the book that he uses around 50 indicators for determining the major trends of the market.. unfortunately, he only describes a few. So thanks for the further detail of some of the things he is looking at.
In light of this new information, what areas are you expecting to see the greatest drops? I guess my question is do you just look at the current worst preforming sectors or do you go with sectors that have a lot of charts pouring over into early stage 4s? I suppose you will tell me you look at the worst charts in the worst preforming as Weinstein discusses but I am just wondering how you go about determining future worst preforming sectors as I like to try and figure out-
Thanks again for the update and hope you had a good time in Thailand-
isatrader
Senior member
- Messages
- 2,965
- Likes
- 136
Good point isa- he does say in the book that he uses around 50 indicators for determining the major trends of the market.. unfortunately, he only describes a few. So thanks for the further detail of some of the things he is looking at.
In light of this new information, what areas are you expecting to see the greatest drops? I guess my question is do you just look at the current worst preforming sectors or do you go with sectors that have a lot of charts pouring over into early stage 4s? I suppose you will tell me you look at the worst charts in the worst preforming as Weinstein discusses but I am just wondering how you go about determining future worst preforming sectors as I like to try and figure out-
Thanks again for the update and hope you had a good time in Thailand-
Thailand wasn't bad, I hit part of the end of the Monsoon, so it tipped down with rain with six days straight when i got there, so I had lots of thai massages, sleep and watched a lot of films which I guess at least gave me a chance to relax, although as you can imagine I wasn't overly happy about the weather as it's a very outdoor kind of place, that mostly shuts down when it rains like that. However, things improved the second week so got to do the normal holiday stuff, but think it's probably my last visit to Thailand for a long time (I've been three times since 2003), as it gets worse every time I go. i.e more overdeveloped, dirtier beaches etc, plus a day of flying including a layover in Singapore is a bit much for a two week break. So I think I might try the Caribbean next year.
To your question... looking at the worst performing charts in the worst preforming sectors is a simplistic way of looking at it. I would suggest looking for stocks moving into early Stage 4A in sectors that are already under performing the S&P 500 or in sectors that are declining in relative strength versus the S&P 500. A good point is when the sector RS drops below it's zero line like we saw with the Nasdaq 100 in early October, as shorting tech since early October would have been very profitable.
A lot of those stocks will have rallied the last few weeks with the broad market and so you might have a good opportunity to get into some of the leading declining stocks with good risk reward settings as they should be still be under their breakdown levels which is now resistance. My entry point would probably be as they roll over and close below their recent short term uptrend lines. But the secondary method entry point B is to put half a position at the pullback to the breakdown point, but I personally like the additional confirmation that it is rolling over first.
goodtyneguy
Active member
- Messages
- 146
- Likes
- 9
Hi folks,
I have my reservations about the US stock markets/indices morphing into a stage 4 decline. The reason is, if you look at the indices of the european countries and in particular Greece, Austria, Belgium, Ireland, Italy & Spain I see stage one bases being formed. I have n't looked any metrics (we don't as we are weinsteiners) but would have thought these countries the are the most undervalued and perhaps all the bad news is factored in. If am correct then these breaking out into stage 2's will at least hold up the US stock markets and eventually they will follow.
I would be interested to hear peoples' thoughts even if it is just to check my chart reading skills. Sorry I am bit short of time to post up some charts at the moment.
isatrader
Senior member
- Messages
- 2,965
- Likes
- 136
Hi folks,
I have my reservations about the US stock markets/indices morphing into a stage 4 decline. The reason is, if you look at the indices of the european countries and in particular Greece, Austria, Belgium, Ireland, Italy & Spain I see stage one bases being formed. I have n't looked any metrics (we don't as we are weinsteiners) but would have thought these countries the are the most undervalued and perhaps all the bad news is factored in. If am correct then these breaking out into stage 2's will at least hold up the US stock markets and eventually they will follow.
I would be interested to hear peoples' thoughts even if it is just to check my chart reading skills. Sorry I am bit short of time to post up some charts at the moment.
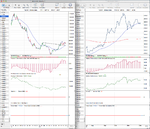
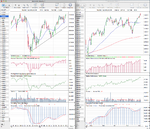
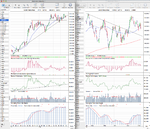
Hi goodtyneguy, thanks for posting for the first time in the thread. It's always good to have more people join in the discussion and add value to the thread. You stage analysis above is mostly correct in that the indexes mentioned are in Stage 1 or Stage 2 currently. I've attached charts for Austria, Spain, Greece, Italy and Belgium that I downloaded historical data for as I don't normally look at these. I see Spain as in Stage 1B, Austria is in Stage 2, Greece is in Stage 2A, Belgium is in Stage 2, but struggling a bit to hold it, and I'd say Italy is still in Stage 1 as it needs to clear the September swing high to move into Stage 2.
I'm not sure if I agree that these will hold up the US markets as they are fairly minor markets and so it would be a case of the tail wagging the dog. They have underperformed for the last few years especially and have been basing as you said. The German DAX has been a relative outperformer in my weekly update for a long time this year and the FTSE 100 began to recently as well, and so it could be that we are starting to see some rotation away from the US equities and back into European equities, but all the major indices have high correlations with each other and so if the US equities markets that Weinstein references do actually fall into deeper Stage 4 declines then the European markets will no doubt take a hit as well and fall back into at least Stage 1 ranges again imo. But portfolio rotation could possibly mean that they continue to outperform in the near term if that does happen and so they may be an area to look to for long only players using the method.
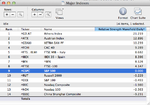
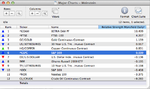
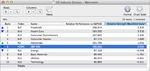
Below is the relative performance table of Major Indexes and I've added the 5 from above to the mix which shows the current out performance of the European markets as they are all above the S&P 500 which is currently in 9th place out of 14 listed.
Attachments
Last edited:
goodtyneguy
Active member
- Messages
- 146
- Likes
- 9
Thanks for the welcome ISAtrader and for including these charts and your relative strength table in your post.
With all the bad news coming out of europe I figured that smart money must be going in when these markets have continued to go up or at least move sideways at times.
Italy and Spain seem to be threatening to break out of a bull flag. A pullback to the trend line at around 750 on the Greek index looks like a good long entry position. Will have to see how these play out to get a trigger long.
Thanks again.
Hi,
I'm new to this forum. This is a great thread! Keep up the good work! Stan Weinstein is my favorite market commentator. I first read his book about 11 years ago or so when I had my backside handed to me after the tech bubble meltdown. I first heard about Stan from Damon Vickers, who had his own radio show at the time.
-g
isatrader Thanks indeed for your very full - taking hours to compose I am sure - update on Weinstein's call on Stage 4 and your suggestions of what to do about it.
I can see how his array of extra indicators might be used (a) to impress clients and (b) as tips to look to bank some profits (e.g. May, October). e.g.We can see the divergence on this: $SPX - 3yr wkly - StockCharts.com
What I don't see, though, is, on a yearly view, a topped stockmarket, as there is neither a falling 30 week WMA nor a break of the last low.
isatrader
Senior member
- Messages
- 2,965
- Likes
- 136
isatrader Thanks indeed for your very full - taking hours to compose I am sure - update on Weinstein's call on Stage 4 and your suggestions of what to do about it.
I can see how his array of extra indicators might be used (a) to impress clients and (b) as tips to look to bank some profits (e.g. May, October). e.g.We can see the divergence on this: $SPX - 3yr wkly - StockCharts.com
What I don't see, though, is, on a yearly view, a topped stockmarket, as there is neither a falling 30 week WMA nor a break of the last low.
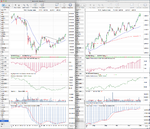
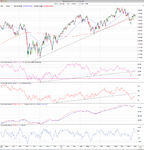
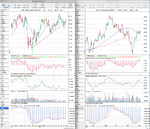
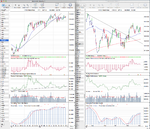
It was a rather long one, but I thought it would be good to put it all down in one post to condense all the information from the various GTA reports and the interview to help us all make sense of the call. As personally from my study of it over the last few years and the multiple examples on here I only have the S&P 500 for example as in the first upswing of a Stage 3 range. From the GTA examples I define the Stage 4A breakdown point as a weekly close below the swing low that formed below the 200 day moving average in mid November. So for me for the S&P 500 to move into Stage 4A it needs to close below 1343.35
The longer term Stage 3 range might be considered as from the January high to the May low, which we had a failed continuation move above in September. If you look at it on a relative basis to the 30 week MA (as you can see on my weekly chart at the bottom) then a 5% move below the 30 week WMA would take us into a strong bear move from here, which would be a move roughly below 1337 which is not inconceivable.
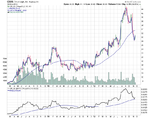
I agree that the numerous indicators are probably to impress his clients, but one indicator that was part of his call though and is talked about over a number of pages in the book is the Momentum Index (MI) which is the 200 day moving average of the Advance Decline line which I've attached. You'll note that it broke it's one year trend line in early November and has made a negative divergence with the recent rally and is currently at similar levels as it was in May. He states in the book on page 285 that the most important signal for the MI is a crossing in either direction of the zero line - currently it's at 82 after making a lower annual high at 191 in September. It's been above the zero line since the 15th July 2009 and it says that the longer the time period that this gauge has been above zero, the more meaningful the signal is when it moves below the zero line.
Readings for the Momentum Index annual highs since the 2009 bull started are:
21st Dec 2009 - 336
23rd Apr 2010 - 328
2nd May 2011 - 223
14th Sep 2012 - 191
So the MI has been above the zero line for three and half years and is putting in lower highs each year, so this may go partly towards explaining his longer term negativity that is not yet evident in the price action itself as we are edging ever closer to the zero line.
One random thing I've been thinking about is the amount of influence someone like Weinstein has, as his service is for institutional investors and hedge funds who pay his $60k a year and so likely follow what he says. On the interview he mentioned about them constantly asking what to do, so because of the size that these clients trade does someone with Weinstein's influence actually move the markets in small ways? i.e. if he tells all his large clients to go short then do they possibly have the size to move markets in any significant way. Just a thought.
Attachments
Last edited:
isatrader
Senior member
- Messages
- 2,965
- Likes
- 136
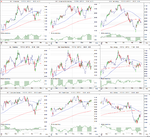
Attached is the updated major charts for your own stage analysis and the relative performance table. The German DAX continues to show the best relative performance of the group while Crude Oil and the Nasdaq 100 are still the weakest. It is interesting to see Copper move back above the S&P 500 for the first time since 2011.

Attachments
-
 FTSE100_Weekly_7_12_12.png145.5 KB · Views: 283
 -
 DAX_Weekly_7_12_12.png138.8 KB · Views: 274
 -
 IWM_Weekly_7_12_12.png133 KB · Views: 371
 -
 NDX_Weekly_7_12_12.png141.2 KB · Views: 326
 -
 SPX_Weekly_7_12_12.png148.8 KB · Views: 330
 -
 US_30yr_Treasuries_7_12_12.png135.2 KB · Views: 340
 -
 TY_10yr_Treasuries_7_12_12.png132.3 KB · Views: 266
 -
 CL_Weekly_7_12_12.png139.9 KB · Views: 271
 -
 HG_Weekly_7_12_12.png131.7 KB · Views: 363
 -
 GC_Weekly_7_12_12.png129.8 KB · Views: 315
 -
 DX_Weekly_7_12_12.png133 KB · Views: 256
 -
 Major_Charts_RS_list_7_12_12.png24 KB · Views: 1,094
isatrader
Senior member
- Messages
- 2,965
- Likes
- 136
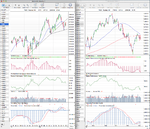
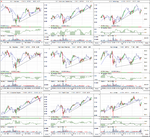
US Industry Sectors Relative Performance
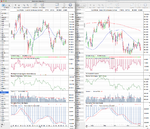
Attached is the updated US Industry sectors weekly and daily charts and below is the relative performance table versus the S&P 500.
Financials (XLF) has moved to the top spot and looks to be in Stage 3B, while Technology (XLK) continues to be the weakest sector in Stage 4A.

Attached is the updated US Industry sectors weekly and daily charts and below is the relative performance table versus the S&P 500.
Financials (XLF) has moved to the top spot and looks to be in Stage 3B, while Technology (XLK) continues to be the weakest sector in Stage 4A.
Attachments
goodtyneguy
Active member
- Messages
- 146
- Likes
- 9
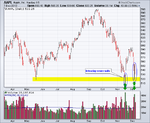
I wonder if Apple will lead the technology sector higher?
ISAtrader, where do you get the "A's" and the "B's" from e.g 3B, 4A, do I need to re-read Weinstein's book again, don't recall them first time, just stages 1,2,3,& 4
Thanks
http://stockcharts.com/h-sc/ui?s=AAPL&p=D&yr=0&mn=9&dy=0&id=p85128525292&listNum=26&a=178983005
ISAtrader, where do you get the "A's" and the "B's" from e.g 3B, 4A, do I need to re-read Weinstein's book again, don't recall them first time, just stages 1,2,3,& 4
Thanks
http://stockcharts.com/h-sc/ui?s=AAPL&p=D&yr=0&mn=9&dy=0&id=p85128525292&listNum=26&a=178983005
Attachments
isatrader
Senior member
- Messages
- 2,965
- Likes
- 136
I wonder if Apple will lead the technology sector higher?
ISAtrader, where do you get the "A's" and the "B's" from e.g 3B, 4A, do I need to re-read Weinstein's book again, don't recall them first time, just stages 1,2,3,& 4
Thanks
AAPL - SharpCharts Workbench - StockCharts.com
Part of my study of Weinstein's method has been to try and get as up to date information as possible as the book was written in 1988, and so I assumed that he probably would have made some refinements to the method over the years, but at the very least I wanted to get a better understanding of the Stages by seeing more examples that I could compare in my charting software. So I tried to source back issues of the Professional Tape Reader newsletter that he did when wrote the book and found that he had began a new service in the last 10 years called the Global Trend Alert. This was a subscription service for a monthly newsletter, with weekly updates and consultation services for institutional traders and hedge fund mangers etc. From this I was able to find a copy of the Global Trend Alert newsletter that someone had made available online which I found had some of the refinements that I was expecting. There haven't been any significant changes in the method since the book was written, but Weinstein has refined the Stages to include sub-stages of A and B and + and -
These additions are:
(A) Early in that Stage.
(B) Late in that Stage.
(+) Outstanding pattern in that Stage.
(–) Unexciting pattern in that Stage.
If you go back to the start of the thread and read through you'll find a copy of the Global Trend Alert from 2005 and numerous examples of the sub-stages. The definitions of the sub-stages can be seen on the GTA report in post #2 or I wrote them out in post #19 here: http://www.trade2win.com/boards/technical-analysis/134944-stan-weinsteins-stage-analysis-3.html#post1695880
Page 41 has the latest and best examples of the sub-stages as I was able to get hold of the March 2012 GTA report after contacting him directly and simply asking, and from that I was able to post hundreds of recent examples of the different stages. Here's the link to the start of the Stage 1B examples: http://www.trade2win.com/boards/technical-analysis/134944-stan-weinsteins-stage-analysis-41.html#post1804190
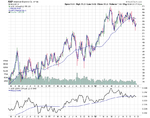
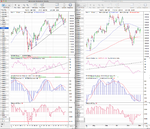
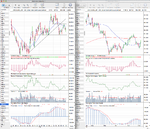
Going back to your Apple question. I have attached my stage analysis of AAPL. I see as currently in Stage 4A - early in the declining phase. It's Mansfield RS has dropped below the zero line and made a lower low, cumulative volume is lower now than at the May low which is not a good sign either. It may well get a bounce at the recent low, but the Stage Analysis indicates imo that there could be further downside, taking it into a full Stage 4. To negate that imo, it would need to break back above the recent swing high and 50 and 200 day MAs above 600. But if it does manage to break down through the support level then it's got thin air down until the low 400s where it started the year, but the swing target from the weekly closes would be a target down to 360.67 which would do some serious damage to the broad market.
If you have the time I'd suggest going through the entire thread, as I feel we've been able to really expand on the book on here and hence understand the method better. As the book is just an overview of the method and I've really tried to go more in-depth on here as I believe it's a great simple method, especially for people with a longer term time frame.
Attachments
Last edited:
goodtyneguy
Active member
- Messages
- 146
- Likes
- 9
Thanks ISAtrader for taking the time to give me such a comprehensive answer. I'll take a look at back as you suggest. There's a lot of volume coming in at that 520 level on Apple. If it breaks that level then it's in big trouble and so are the general markets in my humble opinion. Interesting times no doubt!
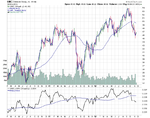
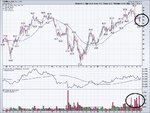
Here is a list of charts showing distribution tops and early or advancing stage 4 declines.
(I'm short all of them)
(I'm short all of them)
Attachments
Similar threads
- Replies
- 2
- Views
- 5K
- Replies
- 170
- Views
- 31K
- Replies
- 9
- Views
- 17K
- Replies
- 0
- Views
- 2K