Stan Weinstein's Stage Analysis

US Industry Sectors

Attached are the updated weekly and daily US Industry sector charts and the relative performance table. Health Care (XLV) takes over the top stop this week with Technology still at the bottom of the table.

attachment.php
 

Attachments

  • US_Industry_Sectors_26_10_12.png
    US_Industry_Sectors_26_10_12.png
    123.4 KB · Views: 234
  • US_Industry_Sectors_D_26_10_12.png
    US_Industry_Sectors_D_26_10_12.png
    117.5 KB · Views: 303
  • US_Industry_Sectors_list_26_10_12.png
    US_Industry_Sectors_list_26_10_12.png
    20.7 KB · Views: 1,293
Attached are the updated major charts for stage analysis and below is the relative performance versus the S&P 500 table ranked by the Mansfield RS Daily reading in the final column, so that you can see what the relative movement was over the last week. Of which there was some notable changes which were not a good sign for equities with the Dollar Index (DX) and the 30 Year Treasuries (US) both crossing above their zero lines. As Treasuries and the Dollar outperform the S&P 500 during bearish periods in the market, so it's another warning sign to be aware of.

attachment.php


The Dollar Index was the key chart last week as it broke out of it's two month consolidation pattern to close the week above the 50 day MA and so is still in Stage 3 currently. If you look at the weekly chart you can see the potential for a large head and shoulders pattern forming since late last year with the left shoulder and head clearly visible. So long term we could have the beginnings of a right shoulder forming, but for the short term it's made a strong Stage 3 swing low, consolidated and has broken out. Which due to it's largely inverse relationship with commodities has put additional pressure on the likes of Gold, Copper and Crude Oil. The Copper chart being of particular note closing below it's swing low beneath the 200 day MA.

The US Treasuries continue to press the top of the short term downtrend line and the 30 Year managed to hold on to the two year uptrend line for another week. Relative performance versus the S&P 500 has been improving since the September low and on the daily time frame crossed above it's zero line this week. It is however still perilously close to breaking down into Stage 4, but with stocks coming under increasing pressure Treasuries could still break out to the upside once again. So it's at a major inflection point here which is crucial for what direction stocks will take.

The US Stocks indices continued to weaken with the S&P 500 closing below the breakout level from September and pivoting at resistance below the 50 day MA. This pattern has already played out in the Nasdaq 100 in October and broke down from it to test it's 200 day MA. So the question is whether the S&P 500 and Russel 2000 will follow it's lead and do the same over the coming weeks. Stage wise the S&P 500 and Russel 2000 are in 2B- and the Nasdaq 100 is in Stage 3 imo.

Interestingly the German Dax continues to be the out performer and has held above the September breakout so far. Since it crossed above it's RS zero line in July it has held the top spot by relative performance for over 3 months and has outperformed the S&P 500 by 6.96%
 

Attachments

  • FTSE100_Weekly_2_11_12.png
    FTSE100_Weekly_2_11_12.png
    145.2 KB · Views: 310
  • DAX_Weekly_2_11_12.png
    DAX_Weekly_2_11_12.png
    138 KB · Views: 238
  • IWM_Weekly_2_11_12.png
    IWM_Weekly_2_11_12.png
    131.6 KB · Views: 244
  • NDX_Weekly_2_11_12.png
    NDX_Weekly_2_11_12.png
    137.6 KB · Views: 250
  • SPX_Weekly_2_11_12.png
    SPX_Weekly_2_11_12.png
    149.9 KB · Views: 283
  • US_30yr_Treasuries_2_11_12.png
    US_30yr_Treasuries_2_11_12.png
    135 KB · Views: 305
  • TY_10yr_Treasuries_2_11_12.png
    TY_10yr_Treasuries_2_11_12.png
    132.8 KB · Views: 296
  • CL_Weekly_2_11_12.png
    CL_Weekly_2_11_12.png
    134.7 KB · Views: 211
  • HG_Weekly_2_11_12.png
    HG_Weekly_2_11_12.png
    137.2 KB · Views: 286
  • GC_Weekly_2_11_12.png
    GC_Weekly_2_11_12.png
    130.8 KB · Views: 252
  • DX_Weekly_2_11_12.png
    DX_Weekly_2_11_12.png
    133.6 KB · Views: 285
  • Major_Charts_RS_list_2_11_12.png
    Major_Charts_RS_list_2_11_12.png
    24.6 KB · Views: 1,210
Last edited:
US Industry Sectors

Attached are the updated weekly and daily US Industry sector charts and the relative performance table. Financials (XLF) takes over the top stop by relative performance this week with Technology still at the bottom of the table.

attachment.php
 

Attachments

  • US_Industry_Sectors_list_2_11_12.png
    US_Industry_Sectors_list_2_11_12.png
    20.7 KB · Views: 1,156
  • US_Industry_Sectors_D_2_11_12.png
    US_Industry_Sectors_D_2_11_12.png
    118 KB · Views: 279
  • US_Industry_Sectors_2_11_12.png
    US_Industry_Sectors_2_11_12.png
    124 KB · Views: 291
Absent for a while (moved to Colombia) but still following. Can't thank the thread enough for all the help and hard work.

I was just wondering how you guys feel about Raulph Lauren (RL) these days. I attached a link but might want to make your own chart anyway since I don't know how to take a screenshot of the charting software I use... Looks to me like it has had a very strong bull run and has been flattening out into a stage 3 consolidation since November or so (possibly complete with H&S top). Would anyone else consider buying puts?
$INDU - SharpCharts Workbench - StockCharts.com

2nd, I bought into Hovnanian Ent. (HOV) and currently have my stop loss set at 3.93 which is just below resistance and of course a whole number as Weinstein suggests. However, with the price jumping so fast right now (even breaking it's own upside trendline), I just thought I would see where you guys would set it. I find it very difficult to set a stoploss on a stock with such a low price bc it seems my percentages are huge.
$INDU - SharpCharts Workbench - StockCharts.com

I will go back and read the chapter on stops but just thought I would put this post out.
 
Absent for a while (moved to Colombia) but still following. Can't thank the thread enough for all the help and hard work.

2nd, I bought into Hovnanian Ent. (HOV) and currently have my stop loss set at 3.93 which is just below resistance and of course a whole number as Weinstein suggests. However, with the price jumping so fast right now (even breaking it's own upside trendline), I just thought I would see where you guys would set it. I find it very difficult to set a stoploss on a stock with such a low price bc it seems my percentages are huge.

I will go back and read the chapter on stops but just thought I would put this post out.

For me personally it would depend on whether it was an investor or trader position and if I had got in at the Stage 2 breakout level just above 3 in early September to how aggressive I would be with the stop loss and would also depend on my position sizing. As as you said, the percentage moves for these size stocks are huge and so the position size should have been adjusted to reflect that imo, so that you are only risking the same percentage of your account as you normally would for any other stock.

Looking at the long term P&F chart you can see that the major volume support zone is between 3.75 to 4.25, so for a trader position I'd personally want to be under that and the 50 day MA which is at 3.69 if I was looking to hold it for a few months as it hasn't had it's first major pullback yet on the P&F chart. But if your in it for a really short term trade then the $5.42 level is roughly the swing target, so I'd personally take some profits around there on 1/3 to 1/2 the position and then wait for the swing low to be broken before getting out of the rest, but that's just me. As you might want to be more aggressive and press your stop loss under the most recent trend line. It's down to individual preferences and trade timescales at the end of the day. But I'm naturally more conservative in my approach personally.
 

Attachments

  • SharpChartv05-1.png
    SharpChartv05-1.png
    25.8 KB · Views: 213
  • SharpChartv05-2.png
    SharpChartv05-2.png
    32.2 KB · Views: 197
  • sc.png
    sc.png
    29.6 KB · Views: 208
  • sc-1.png
    sc-1.png
    28.4 KB · Views: 187
I was just wondering how you guys feel about Ralph Lauren (RL) these days. I attached a link but might want to make your own chart anyway since I don't know how to take a screenshot of the charting software I use... Looks to me like it has had a very strong bull run and has been flattening out into a stage 3 consolidation since November or so (possibly complete with H&S top). Would anyone else consider buying puts?

This is a very difficult chart as it's near the top of it's stage 3 range and has moved back above it's 50 day and 200 day MA, which are close to a positive crossover. Relative performance versus the S&P 500 is also close to crossing into positive territory. However like you mentioned, there is the potential for the current price action to be forming the right shoulder of a large head and shoulders pattern, but if it manages to close a week above 166 then I'd consider it more favourably again. So currently I would rate it a Stage 3B- in that it's late in Stage 3 but that the technical pattern is not very clear and it's volatile.

I've marked up the charts and noted the breakout and breakdown points on the P&F chart which is a close above 166 or close below 148. As for buying puts it's not an area I have any experience in so I can't give any advice on that. But if it breaks below the 148 level then a test of the bottom of the Stage 3 range would seem likely imo, and if that failed to hold then it would move into Stage 4.
 

Attachments

  • RL_Daily_5_11_12.png
    RL_Daily_5_11_12.png
    39.4 KB · Views: 199
  • RL_Weekly_5_11_12.png
    RL_Weekly_5_11_12.png
    29.7 KB · Views: 245
  • RL_PnF_5_11_12.png
    RL_PnF_5_11_12.png
    25.8 KB · Views: 213
Stan Weinstein Interview

Stan has finally done another interview on the Financial Sense Newshour today. Here's the link:
Technician Stan Weinstein: Expect Markets to Head Lower Next 3 - 6 Months

The interview starts 17minutes and 50 seconds into the hour and goes on for 20 minutes. I'm going to take some notes and will post the key points from the interview, but key thing is that he's calling this weeks breakdown as the beginning of Stage 4.
 
Last edited:
SILVER

What are your thoughts at this point on Silver. SLV (and silver futures) have clearly broken out above long term trendline and above its 30 week average. The chart has been basing and this week put in a higher high on the daily.

Thoughts on Silver & Gold.....Much appreciated, I'm a newer student of Stan Weinstein, but a true believer!

Thanks & Happy Trading....
 

Attachments

  • SLV-3yearrs.jpg
    SLV-3yearrs.jpg
    193.4 KB · Views: 185
Last edited:
SILVER

What are your thoughts at this point on Silver. SLV (and silver futures) have clearly broken out above long term trendline and above its 30 week average. The chart has been basing and this week put in a higher high on the daily.

Thoughts on Silver & Gold.....Much appreciated, I'm a newer student of Stan Weinstein, but a true believer!

Thanks & Happy Trading....

I'll give my interpretation of the Silver (SI) futures chart based on the method. Silver formed a small Stage 1 base over the Summer around the level of it's previous 2011 lows. It then broke out of this range in mid August 2012 and broke back above it's 200 day MA and formed a swing high at 31.225, which it then broke above on the 31st August to move into Stage 2A. Since then it's traded up to it's previous resistance around the 35 level and pulled back sharply over the last month and is retesting the Stage 2 breakout level and the 200 day MA.

Relative performance is good versus the S&P 500 as it's above it's zero line and volume on the recent pullback was light and increased on last weeks reversal which is a good sign.

Last weeks price action gave a good indication that this could be a good B entry point, however it needs to close back above the 50 day MA to be considered again imo, otherwise is could head south again as it's trading in a much larger Stage 1 range that's developed since September 2011 and needs to break above the volume resistance and close above 36 to stage more meaningful Stage 2 run. Attached is my charts

P.S. You don't need the indicators that you have on your charts for Weinstein's method. All you need is Relative Performance versus S&P 500 (Price Indicator on stockcharts. Just put $SILVER:$SPX in it to get the ratio of Silver divided by the S&P 500) and Volume. So delete MACD, RSI, and Stochastics as they don't have any use with this method.
 

Attachments

  • SI_Weekly_9_11_12.png
    SI_Weekly_9_11_12.png
    128.5 KB · Views: 213
  • SharpChartv05-21.png
    SharpChartv05-21.png
    33.2 KB · Views: 226
Last edited:
Thanks for feedback on Silver...I have been looking for an outlet to expand and really put to use Stan's Magic. I cleaned up my chart and modeled your HOV chart you recently posted.

RE: GOLD

I know you gave your analysis on Silver, but what about Gold?

Gold appears to have put in a very bullish relative strength signal (as circled) on the weekly Chart.

Thank you for creating this page, its a wonderful resource.
 

Attachments

  • GOLD - signal 11-10.jpg
    GOLD - signal 11-10.jpg
    230.6 KB · Views: 254
Vonage - Interesting Chart

Do you encourage members to upload charts of interest like this one?

Vonage - VG

Broke thru 30 week and pulled back, now Relative Strength is turning up.

Cheers.
 

Attachments

  • VG - Vonage.jpg
    VG - Vonage.jpg
    238.5 KB · Views: 261
Thanks for feedback on Silver...I have been looking for an outlet to expand and really put to use Stan's Magic. I cleaned up my chart and modeled your HOV chart you recently posted.

RE: GOLD

I know you gave your analysis on Silver, but what about Gold?

Gold appears to have put in a very bullish relative strength signal (as circled) on the weekly Chart.

Thank you for creating this page, its a wonderful resource.

They have 93% correlation using the 200 day Average True Range (ATR) and a 97% correlation using the 20 day ATR. i.e. 93% of Silvers price action is because of Gold. And therefore the analysis is the basically same for each one. Silver is just more volatile and used as a leveraged play on Gold.
 
Vonage - Interesting Chart

Do you encourage members to upload charts of interest like this one?

Vonage - VG

Broke thru 30 week and pulled back, now Relative Strength is turning up.

Cheers.

Yep, I'm happy for people to upload charts that are of interest using the method. One thing you need to remember that Weinstein mentioned today on the interview I posted is the "Forest to the Tress" approach which I've talked about many times on the thread. Weinstein's method is a top down analysis method and hence you need to first identify the major trend, then identify the strongest sectors, and finally drill down to strongest stocks in those sectors. If the major trend is negative, then you do the reverse. i.e you find the weakest sectors and short the weakest stocks.

Weinstein said in the interview today that we moved into Stage 4 last week, and so you need to focus on the weakest sectors and then on finding initial Stage 4 breakdowns in the weakest stocks in those sectors.
 
Thanks for the input on HOV and RL and of course for posting the Weinstein interview. Having considered all of the information i think I will set my stops high, wait for a bounce off the current low, and think about exiting. Or maybe just take half like you suggested. After a 58% gain, I can't complain. Time to search for terrible looking charts!
 
US Industry Sectors Relative Performance

To help with the sector part of the method. Attached is this weeks charts of the US Industry Sectors and the relative performance table.

attachment.php
 

Attachments

  • US_Industry_Sectors_list_9_11_12.png
    US_Industry_Sectors_list_9_11_12.png
    20.9 KB · Views: 1,120
  • US_Industry_Sectors_D_9_11_12.png
    US_Industry_Sectors_D_9_11_12.png
    117.9 KB · Views: 322
  • US_Industry_Sectors_9_11_12.png
    US_Industry_Sectors_9_11_12.png
    123.7 KB · Views: 353
Re: US Industry Sectors Relative Performance

To help with the sector part of the method. Attached is this weeks charts of the US Industry Sectors and the relative performance table.

attachment.php

So using your analysis, would it be safe to say that Technology is the weakest sector and time to look for the weakest tech stocks entering stage 4 for shorting candidates?
 
Re: US Industry Sectors Relative Performance

So using your analysis, would it be safe to say that Technology is the weakest sector and time to look for the weakest tech stocks entering stage 4 for shorting candidates?

Yep, Tech has been very weak and has lead the market down move over the last month and so is a good place to look. But any of the sectors under performing the S&P 500 at the bottom of the list will be worth looking at. However, remember you are looking for initial Stage 4A breakdowns with good risk reward ratio and all the normal components of the method. In the case of technology stocks you'll find that a lot have already broken down and so you'd want to instead get in those as they rally back towards their breakdown/resistance levels on a broad market bounce as you still need to make sure you have acceptable risk reward on each trade. i.e don't chase anything.

The S&P 500 is at a major trendline and it's 200 day MA - so I'd personally suggest being very cautious here as short term it's close to oversold levels and may see a bounce soon. So don't rush in...
 
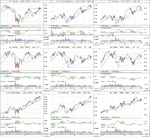
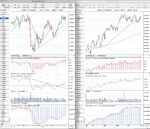
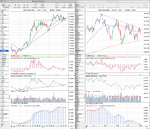
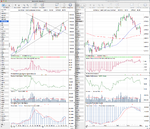
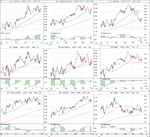
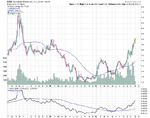
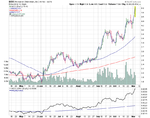
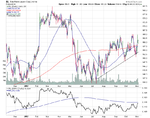
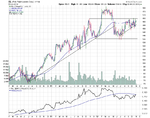
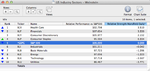
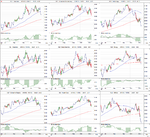
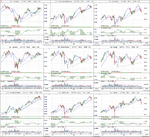
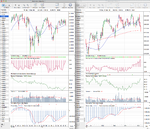
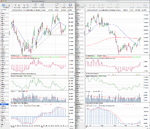
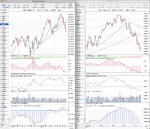
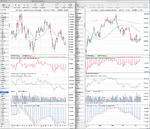
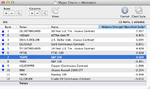
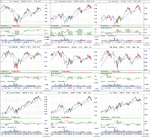
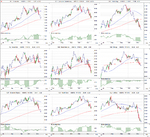
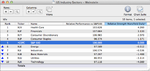
Attached are the major charts for stage analysis and relative performance table.

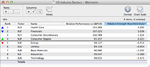
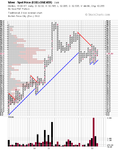
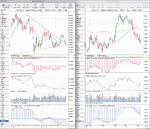
It was a big week in the markets with notable breakouts and breakdowns in the major charts. You'll see from the relative performance table that the 10 and 30 Year Treasuries and the Dollar Index are all now outperforming the S&P 500 highlighting that we are in a downtrend in the stock market.

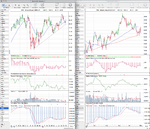
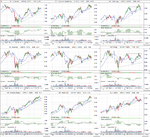
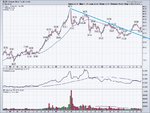
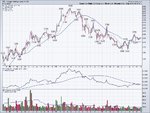
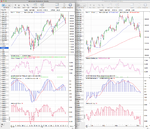
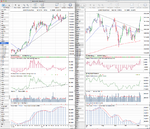
30 Year Treasuries broke out strongly on Wednesday 7th above it's 4 month downtrend line to close the week near the highs of the summer. Volume on the 7th was the highest it's been since June and continued to be strong through the end of the week. Relative performance versus the S&P 500 crossed back above the zero line on the weekly chart and weekly cumulative volume also crossed it's own MA line to give a new buy signal. So the signs are looking positive that it could make a new Stage 2 continuation move and break out of the Stage 3 range it's been in all summer, which would add further pressure to equities if it does.

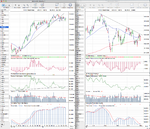
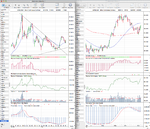
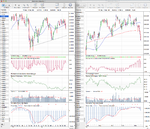
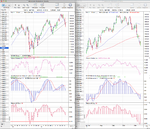
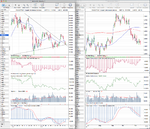
Gold also made a notable move above it's zero line again and has broken it's recent inverse relationship with the Dollar. Volume also picked up and was close to double the previous four weeks average volume. However, it's still below it's 50 day MA and has large volume resistance up to the 1780 level and so needs to get a weekly close back above there imo, as it's still within a much larger one year Stage 3 range currently.

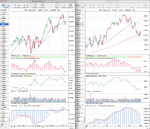
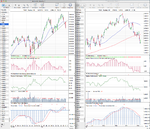
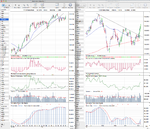
Copper traded down to it's trend line convergence zone of the 1 year down trend line and 3 year uptrend line. Which could provide major support as convergences of long term trend lines are often key support/resistance zones imo.

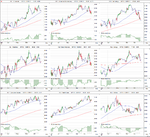
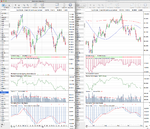
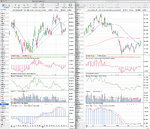
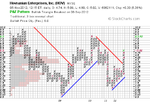
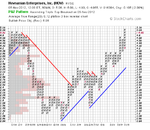
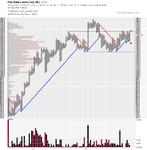
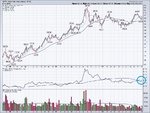
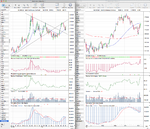
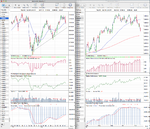
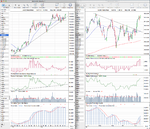
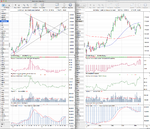
The stock indexes traded down heavily last week and moved us into Stage 4 according to Weinstein in his interview this weekend. 
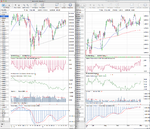
Technician Stan Weinstein: Expect Markets to Head Lower Next 3 - 6 Months. I would like to add a note of caution though to this, as the S&P 500 finished the week right below it's 200 day MA and on a major one year trend line of which this is the third test, and so it could also possibly bounce around here to retest the breakdown around the 1400 level. So if you are not already short stocks or long treasuries from the breakdown/breakout levels then I'd personally suggest standing aside until you get a better risk reward opportunity, as a short trading stop loss on the S&P 500 would go around 1443.85 imo, and so you need a pullback to around 1400 to consider getting in with an acceptable 2.96 x ATR(200) risk.

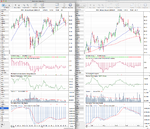
The S&P 500 formed a small head and shoulders Stage 3 range over the last 3 months which gives us a swing target to 1318.61 imo from that range. I personally had considered it in Stage 2B- as I thought the range was too small for Stage 3, and broke down very quickly once it was below the 50 day MA. But it's Weinstein's method after all, so I bow to his superior knowledge. It does however give me further questions about defining the precise entry points for Stage 3 and Stage 4 as from the multiple examples we've been through on here the Stage 4A breakdown point is generally not until price forms a swing low below the 200 day MA and then breaks below that. Obviously, that hasn't happened in this case as the entire Stage 3 range developed above the 30 week SMA and he declared Stage 4 with a close below that and the 30 week SMA. So I need to delve back into the book and chart examples to clarify the Stage 4 breakdown point as I'm obviously being too conservative by waiting until the swing low below the 200 day MA to declare it and should just be looking for a breakdown from a consolidation range that then closes a week below the 30 week SMA. But that's why the recent interviews are useful, as it's the only access that retail investors that follow his method have, which helps us to enhance our understanding of the method and get more specific ourselves. As the $10,000 a year fee for the Global Trend Alert newsletter is simply not accessible for the vast majority of people and the book only gives you the foundations of the method and leaves a number of grey areas which I've tried to understand on this thread. So that's why I like to encourage detailed discussion on here, as Weinstein isn't interested in retail investors, as you might have noticed on the interviews as he's complained multiple times about people contacting him that can't afford his service, so we need to help ourselves by helping each other imo.

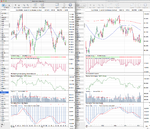
I've said previously that identifying the stages is only part of the method, as Weinstein has a number of proprietary gauges that he follows such as market breadth measures, the momentum index etc. Obviously, we don't have access to all of these measures as they are proprietary, but we can monitor some of them - which I try to do in the market breadth thread on here, so that we can look at the weight of evidence that the market is showing in it's internals ourselves, and improve our market timing.

attachment.php
 

Attachments

  • SPX_Weekly_9_11_12.png
    SPX_Weekly_9_11_12.png
    151.3 KB · Views: 307
  • NDX_Weekly_9_11_12.png
    NDX_Weekly_9_11_12.png
    139.5 KB · Views: 283
  • IWM_Weekly_9_11_12.png
    IWM_Weekly_9_11_12.png
    131.2 KB · Views: 297
  • FTSE100_Weekly_9_11_12.png
    FTSE100_Weekly_9_11_12.png
    142.1 KB · Views: 311
  • US_30yr_Treasuries_9_11_12.png
    US_30yr_Treasuries_9_11_12.png
    137.8 KB · Views: 286
  • TY_10yr_Treasuries_9_11_12.png
    TY_10yr_Treasuries_9_11_12.png
    133 KB · Views: 282
  • CL_Weekly_9_11_12.png
    CL_Weekly_9_11_12.png
    135.4 KB · Views: 287
  • HG_Weekly_9_11_12.png
    HG_Weekly_9_11_12.png
    137.8 KB · Views: 309
  • GC_Weekly_9_11_12.png
    GC_Weekly_9_11_12.png
    127.6 KB · Views: 270
  • DAX_Weekly_9_11_12.png
    DAX_Weekly_9_11_12.png
    136.3 KB · Views: 277
  • Major_Charts_RS_list_9_11_12.png
    Major_Charts_RS_list_9_11_12.png
    24 KB · Views: 1,174
  • DX_Weekly_9_11_12.png
    DX_Weekly_9_11_12.png
    133.2 KB · Views: 276
Last edited:
Attached are the major charts for stage analysis and the relative performance table.

attachment.php


Also attached is the US Industry sector weekly and daily charts and the relative performance table below:

attachment.php
 

Attachments

  • FTSE100_Weekly_16_11_12.png
    FTSE100_Weekly_16_11_12.png
    142.8 KB · Views: 288
  • DAX_Weekly_16_11_12.png
    DAX_Weekly_16_11_12.png
    137.7 KB · Views: 311
  • IWM_Weekly_16_11_12.png
    IWM_Weekly_16_11_12.png
    130.9 KB · Views: 280
  • NDX_Weekly_16_11_12.png
    NDX_Weekly_16_11_12.png
    139.9 KB · Views: 292
  • SPX_Weekly_16_11_12.png
    SPX_Weekly_16_11_12.png
    150.8 KB · Views: 268
  • US_30yr_Treasuries_16_11_12.png
    US_30yr_Treasuries_16_11_12.png
    135.6 KB · Views: 275
  • TY_10yr_Treasuries_16_11_12.png
    TY_10yr_Treasuries_16_11_12.png
    132.1 KB · Views: 274
  • CL_Weekly_16_11_12.png
    CL_Weekly_16_11_12.png
    135.6 KB · Views: 262
  • HG_Weekly_16_11_12.png
    HG_Weekly_16_11_12.png
    134.8 KB · Views: 303
  • GC_Weekly_16_11_12.png
    GC_Weekly_16_11_12.png
    129.3 KB · Views: 330
  • DX_Weekly_16_11_12.png
    DX_Weekly_16_11_12.png
    133.8 KB · Views: 251
  • Major_Charts_RS_list_16_11_12.png
    Major_Charts_RS_list_16_11_12.png
    23.8 KB · Views: 923
  • US_Industry_Sectors_16_11_12.png
    US_Industry_Sectors_16_11_12.png
    118.2 KB · Views: 275
  • US_Industry_Sectors_D_16_11_12.png
    US_Industry_Sectors_D_16_11_12.png
    116.9 KB · Views: 262
  • US_Industry_Sectors_list_16_11_12.png
    US_Industry_Sectors_list_16_11_12.png
    21.2 KB · Views: 906
Last edited:
Top