isatrader
Senior member
- Messages
- 2,965
- Likes
- 136
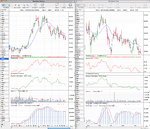
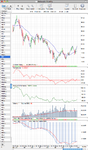
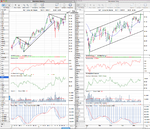
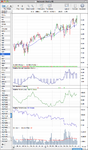
ED is a great example of the Weinstein stage analysis method and using Moving Averages and correction high/lows to set stops.
Using Stan’s approach of a weekly chart and the 30-day MA, you would have been stopped out in mid February 2011when ED violated the 30-day around $48.55 but then you would have bout it back shortly and still holding it now for an excellent gain (plus dividends).
Using a daily chart, the best support area is at the 150-day MA which only triggered a few sell/buy signals during this year with only three low risk entry points.
Question for the group:
How are you using a combination of weekly and daily charts and Moving Averages to make your buy/sell decisions when combined with Stan’s stage analysis?
Here is where it gets confusing - from Stan's book:
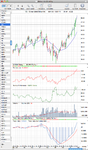
chapter 6, page 196: "a trader should never stay in a position once the 30 day MA is broken"
in the glossary on page 13, chapter 1 on MA, he states: "30-week MA is best for investors, 10-week MA is best for traders"
I translate the above to be 150 days on a daily for 30 week MA weekly and 50 days on a daily for 10 week MA weekly
so what is the take away from the above for a trader using a daily chart: should the 30 day MA be used or the 50 day MA be used?
chart 6-29 (a daily chart) on page 197 shows a stop out set at about the 30-day MA (daily) - the stop is clearly set above the 50-day daily MA
the way im intending to do it is to risk 0.5percent on each trade, and have a total portfolio risk of 20percent . this will enable me to keep existing positions until stopped out. the downside will be could have upto 40positions in a full bull/bear mkt...
isa
Why not drop the sector analysis? Have you backtested its contribution?
Note that Alan Saunders makes no mention of sectors in his article on page one of your thread. Stage Analysis - finding the 'breakout' shares Ask him if it is worth doing.
You were looking at currencies and commodities earlier; there is no sector involved with that (though obviously there is correlation analysis).
WHAT TO BUY
My "Forest to the Trees" Approach
Just as important as when to do new buying is what to buy. This is actually a far more complicated decision to reach. Once you digest the ideas in this section, it too will become routine.
It is really a three-part equation that I call my "Forest to the Trees" approach. What I mean is that you should work from the larger question - how's the overall market - down to the smaller component - which stock looks best to buy. In between these two extremes is the middle part of the equation - which group is acting best technically. So the process unfolds in the following manner:
If you follow this three-step process, you will find yourself heavily invested in the best acting stocks when the market is powering ahead, and sitting on large cash reserves when the overall trend turns bearish.
- What's the trend of the market? If it's negative, you'll want to do very little if any buying, even if you see some stocks breaking out. Your probabilities of success are quite low when the market trend is going against you.
- Which few groups look the best technically? The importance of this question can't be overemphasized since my studies have consistently shown that two equally bullish charts will perform far differently if one is from a bullish sector while the other breakout is in a bearish group. The favorable chart in the bullish group will often quickly advance 50 to 75 percent while the equally bullish chart in the bearish group may struggle to a 5 to 10 percent gain.
- Once you determine that the market trend is bullish and Group A acts the very best technically, the final step in the process is to zero in on the one or two best individual chart patterns in that sector.
Quote taken from page 75
So barring this in mind I've gone back through my trades from the last 3 months and noted the stages of the stocks, the market, the industry sector and the sub sector. And as I expected the majority of the sectors were in Stages 1A to 1B when the stock I've picked has broken out into Stage 2A as I've been trying to identify leaders.