Stan Weinstein's Stage Analysis

nice videos. whats your trade management plan with se?

its a shame sharescope doesnt give the us subindecies charts, as there are a lot more of them than uk, and could really narrow it down....maybe il have to get tc2000 again..
 
nice videos. whats your trade management plan with se?

its a shame sharescope doesnt give the us subindecies charts, as there are a lot more of them than uk, and could really narrow it down....maybe il have to get tc2000 again..

Thanks. I see SE as a Stage 2 continuation buy on the weekly chart, while the market is still in Stage 1. So I believe the rules for that are to go fully in on the breakout as it's a traders entry, but then to manage as normal. I personally use point and figure charts to determine an initial target. Which measures the strength of the upmove and projects from that. 49.5 is the current target from the P&F chart attached, so I'd be looking to take half off at that point and sell the remaining half when it becomes Stage 3 again.

Re: your charting software. I just use an end of day software program and I download the data free from yahoo. So no need for expensive software I think.
 

Attachments

  • SharpChartv05-3.png
    SharpChartv05-3.png
    28.6 KB · Views: 314
Thanks for your reply on currency, isa.
Thanks for video too - tech always takes more time and effort than you expect!
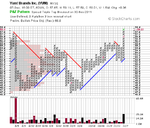
I study gold just simply on the basis of what I leant from the book and from Alan Saunders, who has studied Weinstein for years. ShareHunter
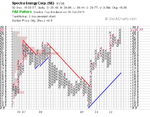
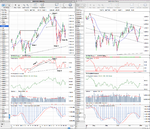
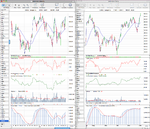
Weekly I think gold is going sideways, a bit like the stockmarket. http://stockcharts.com/h-sc/ui?s=$GOLD&p=W&yr=3&mn=0&dy=0&id=p91201552877
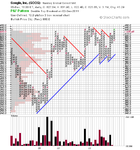
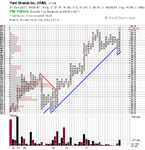
As I understand it, if you rode the stage 2, then you hold till the break down of stage 3, which would be 1612 or 1535, according to how you view emotional tails. You are holding in the possibility of a continuation up, i.e. on a break of 1900 or 1923, according to how you view emotional wicks.
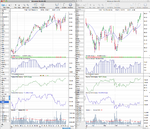
Daily it looks even less clear, so I can't see the Weinstein interpretation except to leave it alone. Shorter-term traders would be looking at the triangle, and it could go either way. http://stockcharts.com/h-sc/ui?s=$GOLD&p=D&yr=0&mn=6&dy=0&id=p79751426216
What I would "expect", though I would not put money on it until the moves have started, is a break down move out of the triangle on the daily and then an up move on the weekly.

Thanks @lplate, your reply from this morning only just appeared for some reason. Maybe it was the links, but thanks.

I agree 1535 would be the breakdown level currently for moving from Stage 3 to Stage 4, but as it's still Stage 2B at the moment so I think that's a way off yet, as it needs to become Stage 3 first which it could do soon if it can't get back above 1800 and instead breaks back below the recent low of 1667 and the moving average turns down. The lack of volume is also concerning.
 
nice vids..
i don't see how mased on weeklies he saw the top before the crash?
 

Attachments

  • sp500.png
    sp500.png
    207.3 KB · Views: 315
nice vids..
i don't see how mased on weeklies he saw the top before the crash?

You're thinking too one dimensional. Remember that there's multiple things to consider when determining stages. There's a whole chapter on it in the book - re-read chapter 8 as it talks through the crash and the breadth indicators that he looks at.
 
GOLD
... as it's still Stage 2B at the moment so I think that's a way off yet ....
Thanks for your view. That's where we differ, I think, as I think the distinctness and high volume of the lower high warns of the start of Stage 3. $GOLD
I can see your interpretation, though, that Stage 3 is not confirmed, as pp36-37 says you need a flatter MA . The "perfect illustration" chart ICH implies a lower low as well, but you don't get that, nor the flatter MA, until part-way through the Stage 3.
So, as I said, I think the daily (which I don't think works well) suggests a move back to 1600, which is not a lower low. Would you think 1600, not a lower low, means it is still in stage 2?
PS, yes the fed gov said it needed to vet my posting, so that is why it was delayed a day. I guess they don't like links to any website which is a potential advertiser.
 
Last edited:
GOLD
Thanks for your view. That's where we differ, I think, as I think the distinctness and high volume of the lower high warns of the start of Stage 3. $GOLD
I can see your interpretation, though, that Stage 3 is not confirmed, as pp36-37 says you need a flatter MA . The "perfect illustration" chart ICH implies a lower low as well, but you don't get that, nor the flatter MA, until part-way through the Stage 3.
So, as I said, I think the daily (which I don't think works well) suggests a move back to 1600, which is not a lower low. Would you think 1600, not a lower low, means it is still in stage 2?
PS, yes the fed gov said it needed to vet my posting, so that is why it was delayed a day. I guess they don't like links to any website which is a potential advertiser.

Thanks lplate, I'm not sure I agree totally. I think due to the lack of reference material that it's hard to gauge exact points of change between the stages. It's always a judgement call and there is some overlap. If you look at the reference examples of Stage 3A from the Global Trend Alert newsletter that I did earlier in the thread here: http://www.trade2win.com/boards/technical-analysis/134944-stan-weinsteins-stage-analysis-4.html#post1700112 then you might see why I think it's not 3A yet.

For me to be 3A it needs to start trading below the 30 week MA for a bit back towards the recent major low and make an initial lower low on the weekly below 1667, which would then cause the MA to start flattening out. Until then I still personally consider it Stage 2B - Getting late in uptrend. Watch carefully. But still a hold with a long term stop below the major recent low. But that's my interpretation from what I've read, but the point of this thread is to discuss the method, so I'm open if you think I've got it wrong.
 
If you look at the reference examples of Stage 3A from the Global Trend Alert newsletter that I did earlier in the thread here: http://www.trade2win.com/boards/technical-analysis/134944-stan-weinsteins-stage-analysis-4.html#post1700112 then you might see why I think it's not 3A yet.

For me to be 3A it needs to start trading below the 30 week MA for a bit back towards the recent major low and make an initial lower low on the weekly below 1667, which would then cause the MA to start flattening out. Until then I still personally consider it Stage 2B - Getting late in uptrend. Watch carefully.
Thanks isa
I'm not cherry-picking, but I think the DHR example of Stage 3 is the nearest to the Gold pattern.
http://tinyurl.com/c2hbzh3
 
Thanks isa
I'm not cherry-picking, but I think the DHR example of Stage 3 is the nearest to the Gold pattern.
http://tinyurl.com/c2hbzh3

Funnily enough, that's the one why I think it's not Stage 3A yet. As on DHR the price is below a flat MA, the relative performance vs S&P 500 is weakening, it's testing the previous low and is trading below the 1 year trendline. But with gold, price is above a rising MA, it's relative performance vs S&P 500 is still strengthening, it's above it's one year trendline and price is over a weeks average true range (ATR(200)) from the nearest low. So different characteristics imo.

I've attached a marked up comparison chart so you can see where I see the key differences. But I think the trendline helps to emphasise the difference I see between them.
 

Attachments

  • stage_comparison_4_12_11.png
    stage_comparison_4_12_11.png
    121.9 KB · Views: 385
Last edited:
Attached is the latest US 30 Year Treasuries chart. It made a lower high two weeks ago and sold off a bit last week before bouncing at resistance on Friday. It's another transitional one. I personally rate it as 2B still until the short term trend line is broken. But as we've discovered the transitional stage is subjective, so it could also be classed as 3A and I believe the book recommends taking partial profits at this point and leaving the remaining stop under the most recent major low. So under 135 I think for that.

This is a very important chart imo, as US 30 Year Treasuries have a strong negative correlation with the S&P 500. So if the lower high holds, then it's good news for equities.
 

Attachments

  • US-30-Year-Treasuries_2_12_11.png
    US-30-Year-Treasuries_2_12_11.png
    135.9 KB · Views: 404
Attached is the latest S&P 500 charts. After to listening to Stan's interview from the 12th November I realised that my rating of a possible Stage 1a on the weekly was too early as he classified it as Stage 4b-

So that means that it is showing that it's late in the downtrend, with a weak technical pattern. And it is too soon to consider buying long positions that you want to hold on to yet and is instead still a short term traders market for the time being with a negative bias still.

I've used the dollar index to measure relative performance and the pattern vs the dollar is much the same as the price action. Cumulative volume on the recent spike down managed to stay above the moving average, so a positive sign. And also closing trendline support on the performance chart also held up to make a higher low.
 

Attachments

  • SPX_weekly_2_12_11.png
    SPX_weekly_2_12_11.png
    137.3 KB · Views: 380
What I'd really like to do, is to create a spreadsheet that lists the stages of every major stock and update it maybe once a month as it will be a fairly big task. My focus is the S&P 500, Nasdaq 100 and Commodities, so if anyone wants to do it for the FTSE 100 or FTSE 350 then that would help.

I think to keep it simple and because we aren't experts on the exact mini stages, it would need to be only the four major stages, so it would not include A or B stages or the + and - symbols. So it would just be Stages 1, 2, 3 or 4 - which would then give a good overview of the market and a general watchlist to drill down further into with deeper analysis. It could even be used as a breadth indicator.

Any thoughts on this?
 
I've been watching Google (GOOG) for the last few months as it is starting to look interesting to me as it is approaching the 4 year highs. If you look at the price by volume on the side of the point and figure chart you'll see that the majority of volume resistance is now below it. So this could be a good breakout candidate for the method if it breaks to new 4 year highs as it's been consolidating for the last two years. One for the watchlist I think.
 

Attachments

  • SharpChartv05-4.png
    SharpChartv05-4.png
    35.4 KB · Views: 300
  • GOOG_monthly_5_12_11.png
    GOOG_monthly_5_12_11.png
    55.2 KB · Views: 400
  • GOOG_weekly_RS_5_12_11.png
    GOOG_weekly_RS_5_12_11.png
    127.1 KB · Views: 312
  • GOOG_weekly_5_12_11.png
    GOOG_weekly_5_12_11.png
    132.3 KB · Views: 326
Stage 2 continuation breakout yesterday on YUM.
 

Attachments

  • YUM_weekly_RS_7_12_11.png
    YUM_weekly_RS_7_12_11.png
    124.9 KB · Views: 374
  • SharpChartv05-5.png
    SharpChartv05-5.png
    32.2 KB · Views: 303
  • YUM_weekly_7_12_11.png
    YUM_weekly_7_12_11.png
    119.3 KB · Views: 736
i presume as it a continuation pattern the intial stop is below the 52.5 support, say 52.2?

That would be the investor stop position. But if you were short term trading it, I think you could go tighter below the gap low of 55.62 on the 30/11. So under 55 maybe.

The 200 day ATR is 1.21, so from yesterdays closing price, the 2x ATR(200) is: 58.01 - (2 x 1.21) = 55.59. So I'd personally try to get a price below 57.41 if you were using a stop below 55 to keep within my 2x ATR risk limit on a short term trade.
 
Here's a 60 min point & figure chart that shows the near term support levels the best imo. Good support in the mid 55 area.
 

Attachments

  • SharpChartv05-7.png
    SharpChartv05-7.png
    26.6 KB · Views: 233
Top