Re: EURAUD Stage Analysis
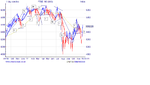
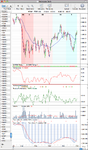
I read this thread with interest, so thanks to you both for keeping it going. For your relative strength component, you chart strength relative to the GSPC, but, as the relevant market is the currency market, would it be better, for example, to look at only the $ pairs and chart them against for example either the DXY (or the inverse of the DXY) or gold?I been focusing on finding some long term trades that have less correlation to the market moves, and currencies seem to be a good option for this. Attached is the monthly, weekly and daily charts for the EUR/AUD forex pair....