isatrader
Senior member
- Messages
- 2,965
- Likes
- 136
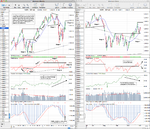
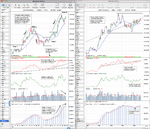
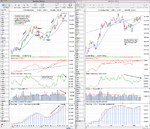
Stage 1A - examples
As a follow up to my previous post outlining the break down of the four stages, I've been going through the Global Trend Alert Newsletter to get some real life examples of the various stages to use as a reference in the future.
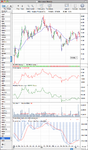
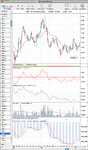
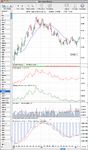
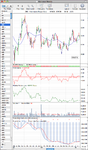
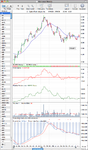
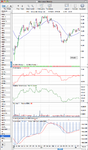
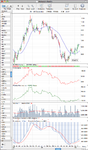
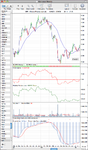
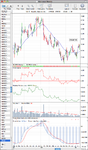
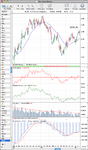
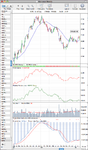
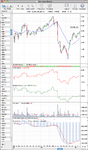
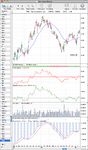
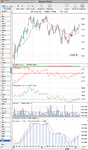
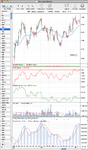
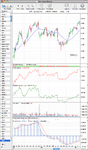
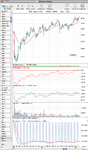
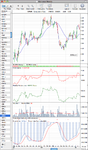
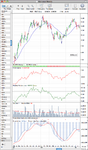
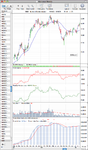
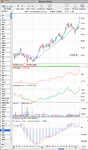
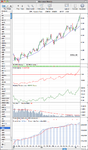
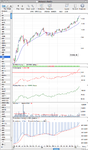
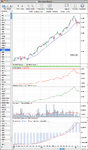
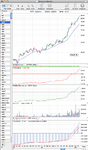
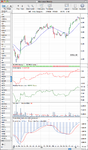
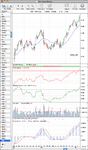
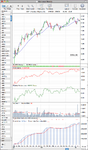
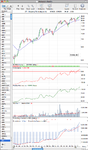
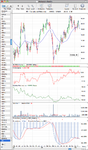
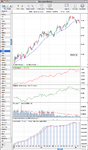
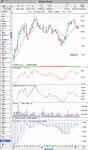
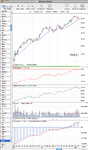
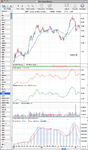
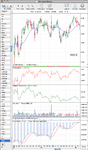
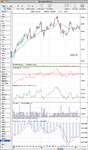
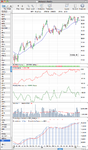
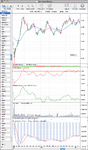
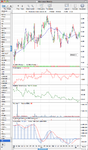
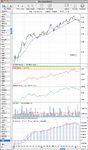
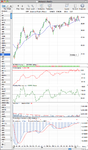
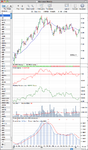
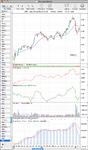
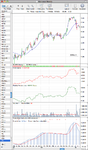
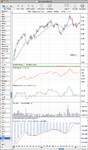
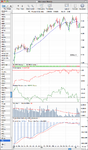
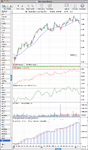
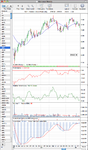
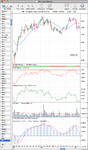
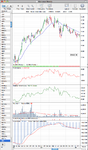
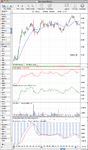
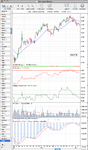
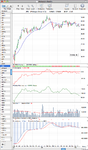
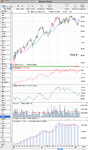
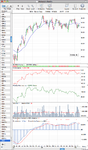
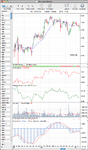
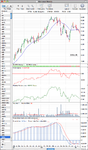
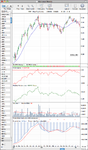
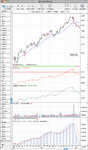
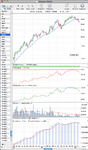
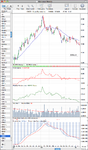
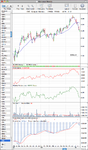
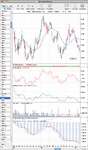
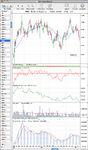
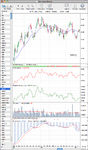
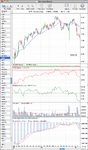
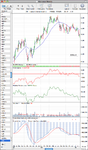
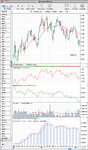
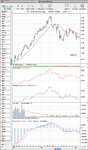
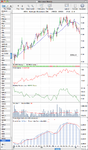
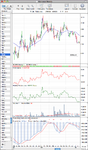
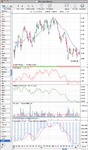
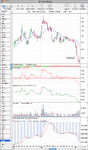
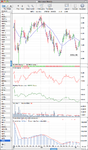
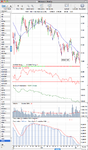
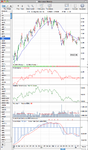
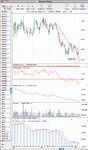
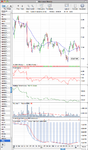
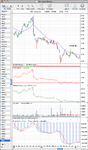
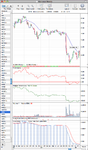
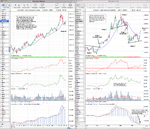
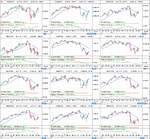
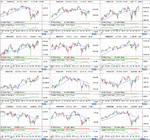
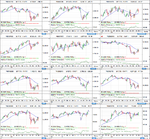
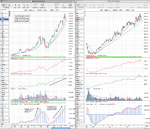
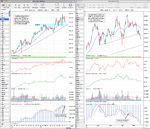
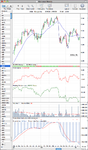
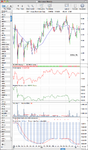
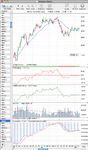
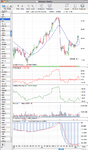
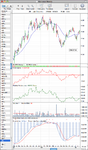
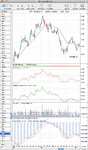
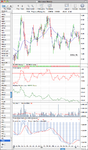
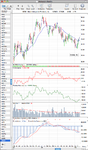
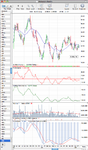
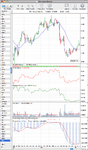
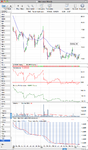
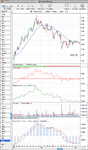
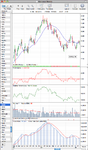
Stage 1A - Start of a base. Needs much more time
Key
(+) Outstanding pattern in that Stage.
(–) Unexciting pattern in that Stage.
As a follow up to my previous post outlining the break down of the four stages, I've been going through the Global Trend Alert Newsletter to get some real life examples of the various stages to use as a reference in the future.
Stage 1A - Start of a base. Needs much more time
Key
(+) Outstanding pattern in that Stage.
(–) Unexciting pattern in that Stage.
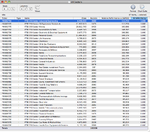
Attachments
-
 AGN_2-25-05.png58.7 KB · Views: 1,764
 -
 AVY_2-25-05.png61.2 KB · Views: 1,577
 -
 BRCM_2-25-05.png55.6 KB · Views: 1,368
 -
 CCE_2-25-05.png56.5 KB · Views: 1,165
 -
 JBL_2-25-05.png59.4 KB · Views: 1,160
 -
 TER_2-25-05.png59.5 KB · Views: 1,065
 -
 PGN_2-25-05.png64.4 KB · Views: 1,048
 -
 MXIM_2-25-05.png62.3 KB · Views: 1,108
 -
 KSS_2-25-05.png62.1 KB · Views: 1,058
 -
 KO_2-25-05.png59.4 KB · Views: 1,119
 -
 THC_2-25-05.png54.6 KB · Views: 1,059
 -
 TIF_2-25-05.png56.1 KB · Views: 1,026
 -
 XLNX_2-25-05.png60.3 KB · Views: 1,153