Solid ECN | Professional Market Analysis | *Video*

USDCAD market update by Solidecn


The US dollar is holding at local highs
During the Asian session, the USDCAD pair shows flat trading dynamics, consolidating near local highs of February 15. Investor activity remains subdued as US markets were closed on Monday for President's Day. At the same time, the news background was quite rich in various publications, and the focus of the market was the aggravation of the geopolitical situation in Eastern Europe. The optimistic sentiments of the traders were leveled after the official Kremlin stated that a meeting of the Russian and US presidents on the Ukrainian crisis was not yet planned. Earlier, the Russian leader announced the recognition of the self-proclaimed Donetsk and Lugansk People's Republics.

In turn, the pressure on the Canadian dollar remains after the publication of rather poor statistics last Friday. Thus, the volume of retail sales for December fell sharply by 1.8%. The focus of investors on Tuesday is a block of data from the US on business activity in February, while Canada will publish a report on ADP jobs for January.

Support and resistance
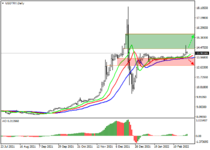
Bollinger bands on the daily chart are growing slightly: the price range expands from above, letting the "bulls" renew local highs. MACD shows an uncertain growth and keeps a very poor buy signal. Stochastic moves more confidently but reflects that USD may become overbought in the ultra-short term.

Resistance levels: 1.2786, 1.2812, 1.285, 1.29.
Support levels: 1.275, 1.27, 1.265, 1.26.​

usdcad_1.pngusdcad_2.png
 
Crypto market update by Solidecn


ETHUSD
Geopolitical tensions are a catalyst for price decline


This week, the ETHUSD pair continued to decline and is currently close to the 2500 mark. The cryptocurrency market as a whole is suffering losses amid the aggravation of the geopolitical situation around Ukraine.

Digital asset prices have gone down following the stock market, with which they have been actively correlating recently. This fact casts doubt on the claims of a number of experts about the possibility of using cryptocurrencies as "safe haven assets". Currently, investors prefer to go into more traditional gold, the quotes of which add value. The current situation signals that the current level of adoption of digital tools by business is not yet sufficient.

In general, the cryptocurrency sector has been declining since November last year, as bidders assume the beginning of a new period of "crypto-winter". In this regard, the comments of the co-founder of Ethereum Vitalik Buterin are interesting, he believes that in the end, a prolonged drop in prices can have a positive impact on digital assets. In a recent interview with Bloomberg, he said that the "bearish" trend in the market allows you to get rid of weak projects, and also reduces the volume of short-term speculative trading.

Support and resistance
The price has reached the lower limit of the Murray trading range at around 2500, the breakdown of which will give the prospect of further decline to the levels of 2187.5 and 1875.

Technical indicators generally demonstrate the continuation of the downward trend: the Bollinger Bands and Stochastic are reversing down, and the MACD histogram is increasing in the negative zone. Stochastic's entry into the oversold zone does not exclude an upward correction up to the level of 2930, but it is unlikely that it will lead to a trend change.

Resistance levels: 2930, 3125, 3300.
Support levels: 2500, 2187, 1875.​

eth.png
 
Market update by Solidecn


S&P 500, component reporting forecasts pull the index down
The S&P 500 index is correcting down amid a significant decline in the bond market, trading at around 4288. 10-year US Treasuries shed 3.48%, falling from 1.927% to 1.863%, while 20-year conservative bonds fell 2.76%, from 2.268% to 2.246%.

Support and resistance
Index quotes are traded in a local downtrend, which might become a global one. Technical indicators are still in the state of an active sell signal: the range of EMA fluctuations on the Alligator indicator is expanding towards the decline, and the AO oscillator histogram is trading in the negative area forming new descending bars.

Support levels: 4215, 4000
Resistance levels: 4375, 4590

sp500.png

Solid ECN Securities
1:1000 Leverage | Spread from Zero | %40 Deposit Bonus | Negative Balance Protection
 
Crude Oil shows strong growth by Solidecn


During the Asian session, WTI Crude Oil prices show a downward trend, consolidating near $93 per barrel. The current decline of the instrument is due to technical factors, while the fundamental picture is generally quite optimistic and provides additional support to quotes.

Quotes are supported by the fact that the dynamics of oil supply growth continue to lag behind aggregate demand against the backdrop of a rather conservative position of OPEC+. The cartel refuses to accelerate production growth, preferring to act according to a previously defined plan. In particular, in February, the alliance increased production quotas by 400K barrels per day. Meanwhile, several participating countries (for example, Venezuela and Iraq) cannot increase production to the permitted level due to insufficient funding for the industry and technical problems with increasing oil production.

Support and resistance
On the daily chart, Bollinger Bands steadily grow. The price range expands but not as fast as the "bullish" sentiment develops. MACD reverses upwards, forming a new buy signal. Stochastic is more straightforward but is rapidly approaching its highs, indicating that the instrument may become overbought in the ultra-short term.

Resistance levels: 93.97, 95, 96.
Support levels: 91.73, 90, 89, 88.​

oil_1.png
 
Market update by Solidecn

AUDUSD, Australian economy received a new impetus to growth

Amid the stabilization of the US currency, the AUDUSD pair is correcting within an uptrend, trading around 0.72.

Yesterday, the Australian authorities announced opening borders for citizens and tourists staying in the country. Now people with a vaccination certificate have the opportunity to visit the country. It was a major step in the revival of the tourism sector, which is losing almost 3B US dollars annually and has declined for more than two years since the start of the coronavirus pandemic.

Also, the "bulls" received an impulse to increase after the publication on Monday of optimistic macroeconomic statistics from Australia:
The index of activity in the manufacturing sector for February increased to 57.6 points. In general, the country's economy continues to recover, and with the opening of borders, the demand for the national currency of Australia will only increase. Additional support for quotes is provided by the growth of commodity markets and a decrease in demand for risky assets against the backdrop of a worsening geopolitical situation in Eastern Europe.

The index of the American currency reacts weakly to any incoming information, trading near the level of 96, which it reached amid geopolitical tensions. As for macroeconomic data, tomorrow's data on business activity in the services and manufacturing sectors could provide local support for the US dollar, but the expected publication of the February consumer confidence index from the Conference Board, which, according to analysts, may fall to 110 points from 113.8 points for January, most likely, will not allow the dollar to strengthen significantly.

Support and resistance
On the global chart, the price moves within a wide channel. Technical indicators are in the state of a poor signal to buy: indicator Alligator's EMA fluctuations range expands upwards, and the AO histogram moved into the zone of purchases.

Resistance levels: 0.7283, 0.7457.
Support levels: 0.7100, 0.6990.​

audusd.png
 
Market update by SolidECN


Crude Oil, the uptrend is possible

Prices for "black gold" continue to grow rapidly against the backdrop of the geopolitical situation in Eastern Europe. The day before, Brent Crude Oil quotes rose above 96.50, but by the end of the session corrected to 93.75.

In general, the situation on the market remains tense.
Investors fear interruptions in the supply of Russian oil and gas to the market in the event of active hostilities on the borders with Ukraine, which is intensified due to the actions of the German authorities, who suspended the certification of the Nord Stream 2 gas pipeline the day before.

Experts believe that Russia will continue to fulfill its obligations under gas contracts, but will not increase the volume of supplies if necessary, not wanting to increase transportation through Ukrainian territory.

The prerequisites for further growth in energy prices on the market remain, although the increase in quotations is somewhat restrained by the possibility of concluding an American-Iranian "nuclear deal". In this case, Iran will be able to bring additional volumes of cheaper oil to the market, but in the current situation, even they are unlikely to be able to fully meet the growing demand.

Support and resistance
The price continues to be in an uptrend, the target of which may be at 100. The key level for the "bears" seems to be at 91 (the center line of Bollinger Bands), the breakdown of which will give the prospect of a corrective decline to 87.5.

However, this variant of the movement seems less likely, since the technical indicators indicate continued uptrend:
Bollinger Bands and Stochastic reverse upwards, and MACD is stable in the positive zone.

Resistance levels: 95, 100, 106.25.
Support levels: 91, 87.5, 81.25.

oil.png
 
Market update by SolidECN


GBPUSD is in a state of uncertainty
Yesterday, the GBP/USD pair corrected downwards and tested the level of 1.3550.


GBP is under pressure as investors fear the imposition of mutual economic sanctions and interruptions in the supply of energy to European countries after the leadership of the Russian Federation recognized the independence of the Donetsk and Lugansk People's Republics.

At the moment, the market has stabilized, as the sanctions against the Russian economy were moderate. The US implied a ban on trade and investment in business on the territory of the new republics introduced measures against the State Development Corporation VEB.RF and Promsvyazbank, as well as several Russian officials.

Five more Russian banks and some officials fell under the UK restrictions. For now, restrictive measures look symbolic, which does not allow the price to drop significantly. However, after a deterioration in the geopolitical situation, their list can be significantly expanded. In this case, Russia may limit the supply of oil, gas, wheat, palladium, nickel, and other metals to the market, adversely affecting European and American production.

Experts fear that global regulators may postpone the tightening of monetary policy in the face of uncertainty. The situation will continue to be quite tense, and cautious investors will diversify their portfolios.

Support and resistance
The key "bearish" level is 1.355. Its and the middle line of Bollinger bands breakdown allows a decline to 1.3427 and 1.3366. The breakout of 1.361 will provide growth towards 1.374.

The indicators do not give a single signal:
Bollinger bands reverse upwards, Stochastic reverses downwards, and MACD is stable in the positive zone.

Resistance levels: 1.361, 1.3772, 1.374.
Support levels: 1.355, 1.3427, 1.3366.​

gbpusd.png
 
Investors increase positions in gold

Gold quotes continue to be traded at increased volumes and are kept in the area of annual highs, at the second most important psychological level of $1900.

The positive dynamics is facilitated by the acceleration of inflation rates in the world and increased geopolitical risks, since the news background regarding the crisis on the borders of Ukraine again occupies a significant place on the current agenda. In the context of global price pressure and the imminent increase in rates by central banks, investors are buying the precious metal as a defensive asset, withdrawing their capital from risky instruments such as stocks and currencies.

The current dynamics also have a local reason.
The Federal Office for Customs and Border Security of Switzerland published a report on the import and export of gold in January 2022, according to which the total export volume of the precious metal from the country amounted to 115.74 tons, which is 20% higher than in December last year, and 43% higher than in January 2021.

Asian buyers account for more than 100 tons:
China ranked first in terms of exports, importing 70 tons of gold; another 11.6 tons were bought by India, and 8 tons were bought by Singapore. The total amount of exports of the precious metal for the month exceeded 6.22B Swiss francs. In turn, the volume of imports to Switzerland also increased to 6.51B Swiss francs, which is significantly higher than in December.

Support and resistance
On the daily chart, the price reached the level of the global high of June 2021 and is now trying to consolidate at this level.

Technical indicators maintain a steady buy signal:
the fast EMAs of the Alligator indicator are above the signal line, and the histogram of the AO oscillator is trading in the buy zone, forming new ascending bars.

Support levels: 1878, 1810.
Resistance levels: 1914, 1950.​

gold.png
 
Market update by SolidECN


USDCAD
American currency took the lead in the pair


Due to ongoing mass protests by Canadian truckers opposing anti-coronavirus measures, the USDCAD pair shows local sideways dynamics and is around 1.2747.

Canadian Prime Minister Justin Trudeau announced that a state of emergency had been introduced in the Canadian capital of Ottawa to contain protests against sanitary measures that have been going on for almost three weeks and stabilize the situation in the country as a whole until at least mid-March. It means that supply disruptions could seriously slow down a strong economic recovery in Canada. As for macroeconomic statistics, no important publications are expected this week, and the national currency is likely to continue to weaken slightly.

Since the beginning of the week, the USD Index has not left the narrow sideways range around 96. Yesterday the US dollar was slightly supported by data on business activity indices. Services PMI for February rose, and Manufacturing PMI amounted to 57.5 points, significantly higher than the January. The data from the Conference Board also was positive. The consumer confidence index fixed at 110.5 points, slightly better than the forecasted.

Support and resistance
On the global chart, the price tries to break the resistance line of the local Triangle pattern.

Technical indicators are in a buy signal:
Indicator Alligator’s EMA fluctuations range expands towards growth, and the histogram of the AO oscillator forms rising bars in the buying zone.

Resistance levels: 1.2788, 1.2938.
Support levels: 1.2697, 1.252.

uscad.png
 
ASX 200, Australian bond market continues to rise

Due to the ending season of corporate reporting and growth in the bond market, the quotes of the leading index of the Australian economy, ASX 200, are correcting in a sideways trend near the level of 7195.

Data provided by the diversified financial company HUB24 Ltd. reflected positive performance, with Q4 2021 revenue of A$80.07B, well above forecasts of A$60.63B. Among the corporations that reported worse than analysts expected was retail retailer Woolworths Group Ltd., whose quarterly revenue was below market estimates of 18.66B Australian dollars and recorded around 15.82B Australian dollars.

As for the bond market, the strong growth that began in the first days of the new year continues now, and the popular 10-year bonds are trading at a yield of 2.266%, which is much higher than last week's 2.100%. Only conservative bonds are in no hurry to actively rise: the yield on 20-year bonds has been holding around 2.700% for the second week already, which is still significantly higher than 2.300% at the beginning of the month.

Support and resistance
The price continues to trade within the global sideways channel, forming another local corrective wave. Technical indicators are ready to reverse and give a buy signal: indicator Alligator's EMA fluctuations range crossed each other, and the AO oscillator histogram moved into the buy zone, forming new upward bars.

Resistance levels: 7285, 7476.
Support levels: 7125, 6910.

asx.png
 
Market update by SolidECN

XRPUSD declines within the general market trend

Quotes of the XRPUSD pair are falling, trading around 0.724 amid increased geopolitical tensions in Eastern Europe. The total capitalization of the crypto market over the past week has decreased to $1.71T, and XRP has lost almost 14%, although large investors have accumulated about $708M in this token, and the number of its holders has increased by 15% since the beginning of the year.

Also, the quotes of the digital asset continue to be under pressure from litigation with the US Securities and Exchange Commission (SEC), whose members argue that XRP is an investment contract traded illegally on the market, and the issuer needs to register the token per US laws.

However, the positive news for Ripple is that last week the Federal Court of the Southern District of New York ruled in its favor and ordered the release of two key documents that could help in the investigation. According to Ripple's general counsel, according to a 2012 study of the project's business model using the US Commodity Futures Trading Commission (CFTC) standards, XRP cannot be considered a security. The issuer noted that it could settle the dispute if both parties cooperate, but lawyer John Deaton said the SEC still does not produce documents that the court ordered to be released.

Support and resistance
On the daily chart, a "bearish" Evening Star pattern has formed, including a Hanging Man candlestick, a strong signal for the asset to decline. After a short consolidation near the resistance level of 0.802 and an attempt to overcome it, the instrument went down and formed a "bullish" Hammer pattern around 0.7099, after which it continued to move up.

Most likely, the price is forming a Falling Three Methods pattern, with the help of which quotes will test the resistance level of 0.802. Its breakout and upper border of the downwards channel allow growth to the zone of 0.9236–1.1823. With a reversal at the level of 0.802, further downward movement into the range of 0.5893–0.2359 is possible.

Resistance levels: 0.8020, 0.9236, 1.0313, 1.1823.
Support levels: 0.5893, 0.4686, 0.3734, 0.2359.

xrp.png
 
EURUSD
Euro updates local lows since the end of January


The European currency shows an active decline against the US dollar during the Asian session, updating local lows from January 31 and approaching strong support at around 1.12.

Noticeable pressure on the positions of the single currency on Thursday morning is put by another aggravation of the situation in the east of Ukraine. Russian President Vladimir Putin announced a special military operation on the territory of Donbass, which provoked a sharp increase in demand for safe assets and led to the fall of the ruble to its lowest level since 2016.

In response, President Joe Biden said the US and its allies and partners would "respond in a united and decisive manner". It is planned that the American leader will discuss the current situation with other members of the G7.

Meanwhile, investors also evaluated the data on inflation in the euro area in January published the day before. As expected, the CPI at the beginning of the year is kept near the level of 5.1%, but in monthly terms, the rate of price growth slowed down somewhat from 0.4% to 0.3%. It is likely that high inflation will put pressure on the positions of the European Central Bank (ECB), which is due to meet for its next meeting in March. The European regulator still maintains a soft monetary policy, and also continues the program of quantitative easing.

Support and resistance
On the D1 chart Bollinger Bands are reversing into the descending plane. The price range is expanding from below; however, it fails to catch the surge of the "bearish" sentiment at the moment.

MACD is going down preserving a stable sell signal. Stochastic keeps a downward direction but is located near its lows, which indicates the risks of oversold EUR in the ultra-short term.

Resistance levels: 1.1255, 1.13, 1.1367, 1.14.
Support levels: 1.122, 1.1185, 1.113, 1.11.

eurusd_1.pngeurusd_2.png
 
AUDUSD
The instrument reversed towards decline


The instrument is actively testing the level of 0.72 for a breakdown, reacting primarily to the news background from Eastern Europe.

Investors are also focused on macroeconomic statistics from the USA today. In particular, the updated annual data on GDP dynamics for Q4 2021 are expected to be released. It is assumed that the US economy added 7%, which is 0.1% higher than the previous estimate. Also during the day statistics on Jobless Claims and data on New Home Sales in January are going to be published.

Support and resistance
Bollinger Bands in D1 chart show moderate growth. The price range is actively narrowing, pointing at the ambiguous nature of trading in the short/ultra-short term. MACD indicator is trying to reverse into the descending plane, keeping the previous buy signal (located above the signal line). Stochastic demonstrates similar dynamics, reversing downwards at the level of "80".

Resistance levels: 0.7250, 0.7300, 0.7328, 0.7369.
Support levels: 0.7200, 0.7160, 0.7100, 0.7050.​

audusd_1.pngaudusd_2.png
 
Market update by Solid ECN


Geopolitical tensions shape GBPUSD current trend
Noticeable pressure on the positions of the single currency on Thursday morning is put by another aggravation of the situation in the east of Ukraine. Russian President Vladimir Putin announced a special military operation on the territory of Donbass, which provoked a sharp increase in demand for safe assets and led to the fall of the ruble to its lowest level since 2016.

No important UK macroeconomic information is expected this week, and the market will continue to work out the recent fundamental events. Today, all remaining coronavirus restrictions are being lifted in the UK, and the country will return to normal life. In particular, citizens may no longer present certificates of full vaccination. Also, all recommendations for transferring workers to remote work are being withdrawn, and wearing masks in enclosed spaces and public transport is canceled.

A two-day conference dedicated to discussing a set of instruments for an effective monetary policy kicks off today, and the first speaker will be the head of the Bank of England, Andrew Bailey, with a report on the current state of the economy. At the end of the meeting, it is planned to develop effective measures to counteract inflation and slow down the recovery of the national economy.

Support and resistance
The asset moves within the global downward channel, reversing downwards. Technical indicators maintain a weakening buy signal: fast EMAs on the alligator indicator are approaching the signal line, and the AO oscillator histogram is forming down bars.

Resistance levels: 1.3564, 1.3720.
Support levels: 1.3417, 1.3189.​

gbpusd_1.png
 
Market update by Solid ECN


USDJPY
The US dollar is developing a "bearish" signal paired with the Japanese yen in Asian trading, correcting after a noticeable increase the day before. At the moment, USDJPY is holding near 115.20, waiting for new drivers to appear. Throughout the week, ultra-high volatility has been observed on world trading floors and investors have abandoned risky assets due to the difficult geopolitical situation. Against this background, the yen is strengthening its position.

During a speech in the national parliament, the head of the Bank of Japan, Haruhiko Kuroda, said that the regulator will continue its ultra-soft monetary policy, despite the fact that rising global inflation is forcing other major central banks to raise interest rates. He also stressed that officials will continue to carefully monitor the impact of the escalation of tensions in Ukraine on oil prices, since Japan is heavily dependent on energy imports.

The Japanese currency is slightly supported by the published macroeconomic statistics from Japan. The Consumer Price Index in the Tokyo region in February showed an increase of 1.0% after rising 0.5% in January. Analysts expected an increase of 0.6%. Excluding Fresh Food prices, inflation in Tokyo increased by 0.5%, accelerating from 0.2%. Markets projected a 0.4% growth.

Support and resistance
In the D1 chart, Bollinger Bands are reversing horizontally. The price range is not changing, reflecting ambiguous dynamics of trading in the short term. MACD, which formed a new buy signal the day before (the histogram is located above the signal line), is again inclined to reverse downwards, reacting to the "bearish" nature of Friday's trading. Stochastic keeps a moderate uptrend, gradually approaching the level of "80" and pointing to the risks of the US currency being overbought in the ultra-short term.

Existing long positions should be kept until technical indicators are clarified.

Resistance levels: 115.28, 115.68, 116.00, 116.34.
Support levels: 115.00, 114.50, 114.00, 113.50.​

usdjpy_1.pngusdjpy_2.png
 
Market update by Solid ECN


USDTRY
Turkey's tourism sector is under pressure


The USDTRY pair is growing, trading around the level of 13.9.

The Turkish lira is declining amid the aggravation of the geopolitical situation in Eastern Europe. According to experts, the negative consequences of the military conflict on the borders of Ukraine are inevitable for the country's economy. The longer air traffic is closed, the more the tourism sector will suffer.

Yesterday, the head of the South Aegean Tourism Association told reporters that over the past ten days, hotel reservations by Ukrainian citizens had stopped, and no new vacation requests had been recorded from Russians for two days. He also stressed that Russia and Ukraine are key areas that bring up to 70% of the total cash flow per year. In a worst-case scenario, Turkey could lose 4–5M tourists from both countries at once, resulting in a loss of $5B in revenue. According to 2022 data, tourism revenue was $22B, and the average profit per tourist increased from $630 to $800–900.

Support and resistance
Currency quotes continue to rise as part of the next wave of global growth. Technical indicators are holding a buy signal, which is getting stronger: the range of EMA fluctuations on the alligator indicator has begun to expand again, and the histogram of the AO oscillator is forming rising bars, being in the buying zone.

Resistance levels: 14.35, 15.66.
Support levels: 13.47, 12.75.​
 

Attachments

  • usdtry.png
    usdtry.png
    18.3 KB · Views: 40
Market update by SolidECN


Gold consolidating around $1900.
During the Asian session, gold prices show near-zero dynamics, consolidating near the level of 1900.00 amid reports that the US and its allies imposed new sanctions against Russia over the weekend. Yesterday, the instrument recorded a moderate decline, opening with a positive gap but closer to the daily session close, gold managed to bounce back partially.

The asset added about 6.7% at the end of February, which was the most strong monthly growth since May 2021. Demand for the metal is supported against the background of the deteriorating situation around Ukraine. At the end of February, Russian President Vladimir Putin authorized a special military operation on its territory, which immediately met with strong criticism from Western countries. To date, unprecedented economic sanctions have been imposed on Russia, and the rhetoric official representatives of European countries and their partners is tightening. Experts believe that against the background of the escalation of the conflict, the position of gold will only strengthen, and quotes will break through the level of $2K per ounce and will be held in this area until the US Federal Reserve meeting, at which decisions on monetary policy adjustment will be announced.

On Tuesday, investors are waiting for the publication of a block of US data on the level of business activity from ISM for February. More interesting drivers will appear on Wednesday when the head of the US Federal Reserve, Jerome Powell, will make a speech in Congress, and the monthly economic review from the regulator will be published.

Support and resistance
On the daily chart, Bollinger Bands are actively growing. The price range is narrowing, reflecting the ambiguous nature of trading in the short term. The MACD indicator falls, keeping a poor sell signal (the histogram is below the signal line). Stochastic, having approached the level of 20 mark, reverses into a horizontal plane, indicating that gold may become oversold in the ultra-short term.

Resistance levels: 1918, 1935, 1952, 1974.
Support levels: 1900, 1877, 1868, 1860​

gold_1.pnggold_2.png
 
Daily market update by SolidECN


NZDUSD consolidation at local highs
The New Zealand dollar traded mixed against the US dollar during the Asian session, holding close to 0.6750. Activity on the market remains restrained amid a sharp increase in volatility, and investors expect new drivers to appear amid the continuation of the armed conflict in Ukraine.

The New Zealand dollar is slightly supported today by optimistic macroeconomic statistics from China; however, in this case, the market reaction remains restrained. NBS Manufacturing PMI in February rose from 50.1 to 50.2 points, which turned out to be better than the forecast of a fall to 49.9 points. In turn, the Non-Manufacturing PMI in February strengthened from 51.1 to 51.6 points, and the Caixin Manufacturing PMI increased from 49.1 to 50.4 points over the same period, also ahead of forecasts at 49.3 points.

Today, markets are waiting for the publication of data from the US on the dynamics of business activity from ISM in the manufacturing sector. Also during the day the Redbook Index of retail prices will be published.

Support and resistance
Bollinger Bands in D1 chart show moderate growth. The price range expands from above, freeing a path to new local highs for the "bulls". MACD indicator is growing, while preserving a rather stable buy signal. Stochastic, having retreated from its highs last week, returns to the ascending plane again, indicating the risks of overbought New Zealand dollar in the ultra-short term.

Resistance levels: 0.6775, 0.6808, 0.6840, 0.6866.
Support levels: 0.6732, 0.6700, 0.6650, 0.6600.​

nzdusd_1.pngnzdusd_2.png
 
Daily market update by SolidECN


USDJPY, the asset is recovering after a decline the day before
Significant pressure on the positions of the Japanese currency at the beginning of the week was exerted by weak macroeconomic data on the dynamics of retail sales. At the end of January, the indicator fell by 1.9%. Today, traders take a lead from the data on Jibun Bank Manufacturing PMI. In March, the indicator showed a decrease from 52.9 to 52.7 points, which turned out to be worse than the market’s neutral forecasts.

The Japanese authorities announced that they would join the sanctions against the Central Bank of the Russian Federation, limiting transactions with it against the backdrop of the development of a military conflict in Ukraine. In addition, the work of 49 companies and the export of high-tech products will be limited. In this regard, traders refrain from acquiring risky assets in favor of more reliable ones, which include the yen.

Support and resistance
Bollinger Bands in D1 chart demonstrate a slight decrease. The price range is narrowing, pointing at the ambiguous nature of trading in the short term. MACD is declining keeping a weak sell signal. Stochastic is showing similar dynamics, demonstrating a rebound from the level of “80”. Current readings of the indicators signal in favor of a further development of a corrective decline in the ultra-short term.

Resistance levels: 115.28, 115.75, 116, 116.34.
Support levels: 114.85, 114.5, 114, 113.

usdjpy_1.pngusdjpy_2.png
 
Tesla Inc. upward dynamics of trading
In Tesla Inc. shares there is a 23% uptrend since a 6-month low on February 25. Since the beginning of this year, the issuer has lost 18.5% in value, and over the past week, quotations have increased by 0.12%, while the S&P 500 index has decreased by 0.17%.

Analysts at Daiwa Capital Markets have upgraded the rating on Tesla Inc. shares to "better than the market" with a target price of 900 dollars. According to analysts, the Russian military special operation on the territory of Ukraine can become a catalyst for changing the trend in the automotive industry towards faster introduction of electric vehicles. Tesla Inc. is ready to benefit from this, as the Shanghai plant provides a cost-effective option against the backdrop of high oil prices. It is also noted that the company intends to build a second plant in China, which will increase the production capacity to 1M cars per year. It is planned to allocate about 1.2B yuan per year for the development of the new enterprise.

In addition, the Tesla Inc. plant in Austin, Texas, is expected to begin production of the Tesla Model Y at the end of Q1 2022. According to analysts at Wedbush Morgan Securities Inc., the launch of production in Austin and Berlin will be crucial to meet demand: by the end of the year, production will grow to 2M vehicles.

Support and resistance
The company's shares have stabilized after a prolonged fall. The instrument has updated multi-month lows and is currently consolidating. Local support and resistance levels are 790 and 880 respectively. The instrument has the potential to resumption. Indicators do not give clear signals: the price is testing MA (50), the MACD histogram has begun to rise. Positions are to be opened from key levels.

Comparing company's multiplier with its competitors in the industry, we can say that #TSLA shares are overvalued.

Support levels: 790, 700, 650.
Resistance levels: 880, 945, 1000.​

tsla.png
 
Top