Solid ECN | Professional Market Analysis | *Video*

Brent Crude Oil market insight by Solid ECN Securities

Oil awaiting the US inventory statistics
Benchmark Brent Crude Oil prices are correcting downwards after closing at more than seven-year highs on Monday, retreating from a yearly high of $95 per barrel and currently trading just above $91. The correction in the asset is supported by reports about the withdrawal of part of the Russian troops from the border with Ukraine.

Also, investors are awaiting statistics on weekly inventories from the Energy Information Administration (EIA) after the American Petroleum Institute (API) reported a reduction in the figure by 1.076M barrels, which was below the expected value. According to preliminary forecasts, the EIA will record a decrease in inventories, which may increase pressure on asset quotes.

Support and resistance
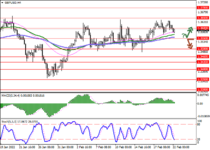
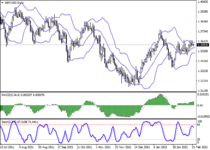
The instrument moves within the Expanding formation global pattern on the global chart, having reached the resistance line. Technical indicators hold a weakening buy signal: indicator Alligator's EMA fluctuations range narrows, and the AO oscillator histogram forms local bars with a downward trend in the buy zone.

Resistance levels: 93, 95.38.
Support levels: 89.72, 85.32.​

oil.png
 
USDCAD market insight by Solid ECN Securities

The instrument develops flat dynamics
The US dollar is again trading with upward dynamics against the Canadian currency during the Asian session, testing 1.27 for a breakout.

Considerable support for the US currency is provided by macroeconomic statistics from the US on consumer inflation published the day before.

Support and resistance
In the D1 chart, Bollinger Bands are reversing horizontally. The price range is changing slightly, but remains rather spacious for the current level of activity in the market. MACD is trying to reverse upwards keeping a previous sell signal (located below the signal line). Stochastic keeps a fairly strong downward direction and does not yet react to the resumption of growth of the US currency.

Resistance levels: 1.27, 1.275, 1.2786, 1.2812.
Support levels: 1.265, 1.26, 1.2558, 1.25.​

usdcad_1.pngusdcad_2.png
 
Silver market update by Solid ECN Securities

Silver prices are consolidating near 23.5
The instrument still cannot recover to the local highs renewed on February 15. Then the reason for the wave of sales was the weakening of geopolitical tensions in Eastern Europe when it became clear that the forecasts and assumptions about possible military operations on the territory of Ukraine did not materialize.

Although investors have turned their attention to the usual macroeconomic background and started predicting the actions of world regulators, certain geopolitical risks remain, and therefore the demand for safe assets is not completely reduced. Also, despite the further growth of inflationary risks, the US Federal Reserve is in no hurry to adjust its monetary policy vector.

On Thursday, American investors focus on the Initial Jobless Claims release. It is expected that the value for the week of February 11 will decrease from 223K to 219K.

Support and resistance
On the daily chart, Bollinger bands grow moderately. The price range narrows slightly but remains quite spacious for the current level of activity in the market. MACD tries to reverse downwards and prepares to form a sell signal (the histogram should be below the signal line). Stochastic shows a more confident decline and signals further development of downward dynamics in the nearest time intervals.

Resistance levels: 23.6, 24, 24.37, 24.67.
Support levels: 23.32, 23, 22.7, 22.4.

silver_1.pngsilver_2.png
 
EURUSD market insight by Solid ECN Securities

The market consolidates to remain neutral
The EURUSD pair moves sideways around the level of 1.1346, correcting after the growth in the previous two trading sessions, which led to the renewal of local highs of February 11 due to positive macroeconomic statistics. Today, the European Central Bank (ECB) will publish its monthly report, which may positively impact the dynamics of the euro.

The USD Index is at the week's beginning, around 96. Investors are reacting to the minutes of the January meeting of the US Federal Reserve, published yesterday. The majority of the regulator's representatives are set for a faster increase in interest rates than previously thought.

Support and resistance
The asset is moving within a wide sideways range. Technical indicators are in a state of uncertainty: indicator Alligator's EMA fluctuations range narrowed almost completely, and the histogram of the AO oscillator forms downward bars, approaching the transition level.

Resistance levels: 1.148, 1.169.
Support levels: 1.1279, 1.1116.

eurusd.png
 
USDCHF market update by Solid ECN Securities

The US dollar updates local lows
The US dollar showed a moderate decline against the Swiss franc during the morning trading session, again poised to test the strong support at 0.92. The day before, the instrument also made attempts to approach this level, but then the "bearish" momentum was not enough.

It is worth noting that investors practically ignored the strong macroeconomic statistics from the US that appeared yesterday. In particular, the volume of Retail Sales in the country showed a strong growth. The dynamics of Industrial Production were also positive. In January, production volumes increased.

Today, during the day, investors expect the publication of statistics on the dynamics of Imports and Exports for January from Switzerland. The US, in turn, will publish data on the Jobless Claims for the week ended February 11.

Support and resistance
On the D1 chart Bollinger Bands are sharply reversing downwards. The price range is narrowing actively, reflecting the emergence of ambiguous dynamics of trading in the short term. MACD is going down, keeping a fairly stable sell signal (located below the signal line). Stochastic keeps a confident downward direction but is already approaching its lows, which indicates the descending risks of oversold USD in the ultra-short term.

Resistance levels: 0.922, 0.925, 0.9276, 0.93.
Support levels: 0.92, 0.9177, 0.9157, 0.9125.

usdchf_1.pngusdchf_2.png
 
FTSE 100 Market update by Solid ECN Securities


Positive reporting pushes quotes up
The FTSE 100 index is trading near annual highs at around 7570 on the back of positive reports from commodity companies.

The world's largest supplier of commodities and rare earths, Glencore Plc, released a strong report, according to which EBITDA increased by 84% for the year to 21.3B dollars, while the company's net income was 5.0B dollars. In turn, net debt decreased by almost 2 times to 6.0B dollars. On the back of positive results, the issuer announced the launch of a new 550M dollar share buyback program.

Royal Gold Inc., another large precious metals and royalty trading company in the sector, reported quarterly revenue of 168.03M dollars, beating analysts' forecast of 165.4M dollars. Earnings per share were 1.04 dollars, with market estimates of 0.9 dollars.


Support and resistance
The index quotes are traded within the global ascending channel, still holding within it. Technical indicators are in a weakening buy signal state: the fluctuation range of the Alligator indicator EMAs is narrowing and the histogram of the AO oscillator is forming new descending bars, while approaching the transition level.

Support levels: 7510, 7330.
Resistance levels: 7620, 7800.​

ftse.png
 
GBPUSD market update by Solid ECN Securities


GBPUSD prerequisites for a trend change
The GBPUSD pair continues the upward trading dynamics, trying to break the resistance level of 1.361 at the moment, which will allow quotes to continue rising to their January highs.

Yesterday's UK macroeconomic statistics supported the pound's position, as it supported the further tightening of monetary policy by the Bank of England at its regular meeting in March. Thus, the annual inflation rate was fixed at a new 30-year high of 5.5% (the indicator is growing for the fourth month in a row). The negative trend indicates a rising cost of living and will only worsen this year as electricity bills rise 54% and taxes rise in April.

The Bank of England expects inflation to peak at 7.25% by then, more than the 2% target.

However, the difficult situation in the economy, observed at the moment, supports the quotes of the national currency, as investors are looking forward to the moment when the British regulator moves to tighten monetary policy and raise interest rates decisively. Against this background, the GBPUSD pair may change the downtrend to an uptrend and renew the January highs around 1.3710.

Support and resistance
The long-term trend in the GBPUSD pair remains downwards. The key trend resistance is at 1.371. Now, buyers are testing the level of 1.361. If it is held, a decline to 1.351 is likely to follow.

The medium-term trend is upwards. At the end of January, market participants tested the key support 1.3404–1.337. The level was kept, which led to the growth of the GBPUSD rate. The first growth target is the January high of 1.3740 The second target is zone 2 (1.3883–1.3848).

Resistance levels: 1.361, 1.371, 1.382.
Support levels: 1.351, 1.3418, 1.3365.​

gbpusd_1.pnggbpusd_2.png
 
WTI Crude Oil market update by Solid ECN Securities

Pending nuclear deal decision
The North American WTI Crude Oil price corrects within a sideways trend, trading around the level of 90.5.

While investors are monitoring the situation around political tensions on the borders of Eastern Europe, new drivers that can determine the movement of energy prices have appeared on the market. Yesterday, Iran's chief negotiator Ali Bagheri Kani said that dialogue with Western countries on the "nuclear deal" is close to completion. The process will probably end in a few days after some "political decisions" from Iran are presented.

Most experts believe that Iran is in dire need of oil revenues. If the deal is concluded, the inflow of Iranian crude to the market will be very fast and voluminous – from 0.5 to 1.0M barrels per day in the second half of the year, which can correct asset price by $10-$15.

Support and resistance
The price moves within the long-term Expanding formation pattern on the global chart. Technical indicators maintain a weakening global buy signal: indicator Alligator's EMA fluctuations range narrows, and the histogram of the AO oscillator forms downward bars in the buying zone.

Resistance levels: 93, 96.
Support levels: 88, 82.5.​

oil.png
 
Solid ECN Securities
Trade with a True ECN Broker


New Zealand currency develops "bullish" momentum
The New Zealand dollar shows a moderate growth in pairing with the US currency in trading in Asia, testing 0.67 for a breakout. NZDUSD has been developing a "bullish" momentum since February 15 and is currently preparing to renew local highs from February 10.

The instrument was supported yesterday by rather weak data from the US on the dynamics of jobless claims. The number of Initial Jobless Claims for the week ended February 11 increased by 23K to 248K, while the market expected a moderate decline to 219K. Also, investors are somewhat disappointed by the lack of a clear understanding of the pace of a possible increase in interest rates by the US Federal Reserve at the March meeting.

In turn, the Reserve Bank of New Zealand (RBNZ) is pursuing a more transparent policy, although here everything depends on the current economic situation. Meanwhile, manufacturing inflation in New Zealand showed a marked slowdown. The Producer Price Index in Q4 2021 slowed from 1.6% to 1.1%, which turned out to be worse than the neutral market forecasts.

Support and resistance
Bollinger Bands in D1 chart show moderate growth. The price range is expanding, but hardly conforms to the activity of the "bulls" in recent days. MACD grows, preserving a stable buy signal (located above the signal line). Stochastic keeps its upward direction but is rapidly approaching its highs, which reflects the risks of overbought instrument in the ultra-short term.

Resistance levels: 0.6732, 0.6761, 0.6800, 0.6840.
Support levels: 0.6700, 0.6650, 0.6600, 0.6568.​

nzdusd_1.pngnzdusd_2.png
 

AUDUSD Market Update
During the Asian session, the AUDUSD pair has been trading near local highs of February 10, testing the level of 0.72 for a breakout.

Significant support for the instrument is provided by rather poor macroeconomic signals that have been coming to the market from the US in recent days. In particular, yesterday, investors drew attention to the growth in Initial Jobless Claims.

Support and resistance
On the daily chart, Bollinger Bands actively grow. The price range changes slightly, limiting the pace of development of "bullish" dynamics in the short term. MACD grows, keeping a relatively strong buy signal (the histogram is above the signal line), and tries to consolidate above the zero line. Stochastic shows similar dynamics but indicates that the instrument may become overbought in the nearest time intervals.

Resistance levels: 0.72, 0.7250, 0.73, 0.7328.
Support levels: 0.716, 0.71, 0.705, 0.7.​

audusd_1.pngaudusd_2.png

Solid ECN Securities
1:1000 Leverage | Spread from Zero | %40 Deposit Bonus | Negative Balance Protection
 
GBPUSD, UK economy shows stability

Due to the strengthening of the British currency, the GBPUSD pair is trading in an uptrend around 1.3608.

The recent report on consumer prices contributes to the positive dynamics of the pound. In January, the indicator fell by 0.1% MoM, which significantly slowed down the growth of the annual value, which as a result rose slightly to 5.5% from 5.4% a month earlier. These data indicate that the measures taken by the Bank of England at the end of last autumn are having the desired effect, and the UK is perhaps the only one of the world's leading economies that has managed to stabilize inflation and bring it under control.

As for the US dollar, the next week ends with almost zero dynamics. All the positive caused by the statements of US Federal Reserve officials about the imminent increase in rates was leveled by macroeconomic statistics, which indicates the growth of problems in the national economy. Thus, the number of initial applications for unemployment benefits rose to 248K from 225K a week earlier, although analysts expected a decrease to 219K. The volume of construction of new houses in January decreased to 1.638M from 1.708M in the previous period, and the construction volume index was –4.1% compared to an increase of 0.3% in December.

Support and resistance
The asset moves within the global downward channel, forming a local wave of growth. Technical indicators maintain an increasing buy signal: fast EMAs on the Alligator indicator are above the signal line, and the AO oscillator histogram trades above the transition level.

Support levels: 1.3566, 1.3421.
Resistance levels: 1.3686, 1.3825.​

gbpusd.png

Solid ECN Securities
1:1000 Leverage | Spread from Zero | %40 Deposit Bonus | Negative Balance Protection
 
DAX 30 market update by Solid ECN Securities


DAX 30 is correcting upwards trading at 15327 on positive component reports.
One of the world leaders in the production of alcoholic beverages, Heineken, showed another strong quarter, which also contributed to a positive annual result.

The growth leaders in the index are:
RWE AG (+4.66%), Continental AG (+3.29%), Delivery Hero AG (+3.16%), Beiersdorf AG (+2.36%).

Among the leaders of the decline are:
Infineon Technologies AG (-2.61%), Fresenius SE (-2.13%), Siemens AG Class N (-2.13%).

Support and resistance
On the global chart, the asset is trading within a wide sideways channel, trying to rebound from the support line. Technical indicators maintain a sell signal: the EMA fluctuation range on the Alligator indicator is still directed downwards, and the AO oscillator histogram continues to form new rising bars, being in the sell zone.

Support levels: 15170, 14800.
Resistance levels: 15510, 16260.​

dax30.png
 
Solid ECN Market Analysis


USDCHF, waiting for a fundamental growth driver
This week, the USDCHF pair falls to the level of 0.92 against the backdrop of the publication of the minutes of the US Federal Reserve's Open Market Committee, which generally reflected the "dovish" rhetoric.

Regulatory officials agreed that it would be appropriate to lift monetary easing faster than expected if inflation does not ease, but meeting minutes did not reinforce investor expectations for a 50 basis point rate hike at the upcoming March meeting. Also, the global outflow of capital into shelter assets due to the escalating Russian-Ukrainian conflict led to a decrease in the yield of US bonds and, as a result, a downward correction in the US dollar.

Economic data increased the dynamics of sales of the US currency. The volume of New Homes Sales for January decreased. Initial Jobless Claims unexpectedly increased and amounted to 248K. Philadelphia Fed manufacturing index was worse than expected and amounted to 16.0 points.

Today, investors expect the publication of US Existing Home Sales for January. The indicator may decrease by 1.0% compared to the previous month. Negative statistics from the US, together with disappointing reports from the regulator, are pushing the pair to February lows in the 0.9177 area. If traders break through this support level, a deep decline in quotations down to 0.9089 is possible in the medium term.

Support and resistance
The long-term trend remains upwards. The key support is at 0.9177, and holding it will allow the rate to rise to 0.9270. A breakdown of the level of 0.9177 will allow sellers to lower the price to 0.9089.

Resistance levels: 0.9250, 0.9270, 0.9339, 0.9360.
Support levels: 0.9177, 0.9089, 0.9033.​

usdchf_1.pngusdchf_2.png
 
Market insights by Solid ECN Securities


EURUSD, the market is in a state of uncertainty
The market is in a state of uncertainty amid geopolitical risks and the variability of further actions of the American and European regulators. Investors expect further aggravation of the conflict around Ukraine. It is not yet moving into a military phase, but in the event of a negative development of events, a sharp increase in energy prices and new problems with the supply of components and raw materials are likely.

Meanwhile, policy makers in the EU and the US are divided on moving forward with monetary policy, which is also making the market uncomfortable. Most members of the European Central Bank (ECB), led by President Christine Lagarde, are on a wait-and-see basis, believing that inflation will slow down by itself during the year due to the receding of the coronavirus pandemic.

The opposition also exists within the regulator, represented by European regulator board member Isabel Schnabel and French central bank governor Francois Villeroy de Galhau. They favor an early end to the emergency bond-buying program with the prospect of further rate hikes. But supporters of tougher policies are still in the minority.

US Federal Reserve officials agreed to a rate hike in March but disagreed on how steep it should be. Some members of the regulator (San Francisco Fed President Mary Daly Minneapolis Fed President Neil Kashkari) favor a cautious increase in rates by 0.25%. They are now mainly opposed by the head of the St. Louis Fed, James Ballard.

Yesterday, he reiterated the need for drastic measures; otherwise, inflation could get out of control. In general, investors are not yet sure what actions they can expect from regulators in the future.

Support and resistance
The key “bullish” level is 1.1410, which breakout allows growth to 1.1475 (Murrey [4/8]), 1.156. A downward of Bollinger bands middle line and 1.1290 allows a decline to 1.1145.

Resistance levels: 1.141, 1.1475, 1.156.
Support levels: 1.129, 1.123, 1.1145.​

eurusd.png
 
USDJPY market update by Solid ECN Securities


The pair Consolidating around 115.
The US dollar shows mixed dynamics against the Japanese yen in Asian trading, consolidating near the psychological level of 115.00.

Last week, the US currency showed a moderate decline, but the situation remained ambiguous, and traders unsuccessfully tried to assess the risks of deterioration in the geopolitical situation in Eastern Europe. After some improvement, the situation on the borders of Ukraine becomes tense again, which led to a surge in demand for safe assets. So far, the parties adhere exclusively to diplomatic lines of solving the problem; however, the media are full of various negative scenarios.

On Monday, pressure on the yen is also exerted by weak macroeconomic statistics from Japan. Jibun Bank Manufacturing PMI in February showed a steady decline, which turned out to be worse than the average forecasts. Today is a public holiday in the US, so business activity statistics will only start appearing on Tuesday.

Support and resistance
On the D1 chart Bollinger Bands are trying to reverse horisontally. The price range is narrowing, pointing at the ambiguous nature of trading in the short term. MACD is going down preserving a moderate sell signal. Stochastic keeps a confident downward direction but is already approaching its lows, which indicates the risks of oversold USD in the ultra-short term.

Existing short positions should be kept until technical indicators are clarified.

Resistance levels: 115.28, 115.67, 116, 116.34.
Support levels: 115, 114.5, 114, 113.5.​

usdjpy_1.pngusdjpy_2.png
 
Gold renews all-time highs - Market update by Solid ECN Securities


During the Asian session, gold prices are falling, retreating from record highs to consolidate below the psychological level of 1900 under the influence of technical reasons. The news background provides significant support to the instrument, as the crisis around Ukraine occupies a significant place on the current agenda again.

An additional factor in strengthening the asset is inflationary pressure in the world's largest economies. First of all, investors are concerned about the sharp rise in prices in the US, where consumer inflation rates are kept near 40-year highs. Analysts and economists at JPMorgan Chase & Co. released a renewed forecast, according to which the US Federal Reserve may raise the rate nine times in a row, thus bringing it to 2.50% by mid-2023.

Support and resistance
On the daily chart, Bollinger Bands steadily grow. The price range expands but not as fast as the "bullish" sentiment develops. MACD grows, maintaining a fairly strong buy signal. Stochastic approached its highs and reversed into a horizontal plane, indicating that the instrument may become overbought in the ultra-short term.

It is better to wait for the clarification of signals from the technical indicators to open new trading positions.

Resistance levels: 1900, 1908, 1916.
Support levels: 1886, 1879, 1868, 1860.

gold_1.pnggold_2.png

Solid ECN Securities
1:1000 Leverage | Spread from Zero | %40 Deposit Bonus | Negative Balance Protection

Trust Pilot Score
⭐ ⭐ ⭐ ⭐ ⭐
 
USDCHF, the US dollar remains under pressure ➡️ Solid ECN Securities


The US dollar shows a moderate decline against the Swiss franc during the Asian session, again testing 0.92 for a breakdown. USDCHF is close to its local lows of February 3, updated last Thursday.

American markets are closed today on the occasion of the President's Day, but investors are still taking a lead from moderately optimistic signals from last Friday. Statistics from the US pointed to an increase in Existing Home Sales. Meanwhile, statistics from Switzerland are somewhat more restrained. At the end of last week, data appeared indicating a slowdown in industrial production in Q4 2021.

The instrument's quotes are under pressure from the threat of a military conflict on the borders of Ukraine. It is worth noting that the authorities are trying to resolve the situation through diplomacy. Representatives of the US State Department announced on Thursday that they had sent a letter to the head of the Russian Foreign Ministry, Sergei Lavrov, with a proposal to hold a face-to-face meeting in Europe "to resolve the crisis without conflict".

Support and resistance
Bollinger Bands in D1 chart demonstrate flat dynamics. The price range is narrowing from below, pointing at the multidirectional nature of trading in the short/middle term. MACD is going down preserving a stable sell signal. The indicator is trying to consolidate below the zero level. Stochastic keeps a confident downward direction but is approaching its lows, which indicates the risks of oversold USD in the ultra-short term.

Resistance levels: 0.922, 0.925, 0.9276, 0.93.
Support levels: 0.9175, 0.9157, 0.9125, 0.91.​

usdchf_1.pngusdchf_2.png


Solid ECN Securities
1:1000 Leverage | Spread from Zero | %40 Deposit Bonus | Negative Balance Protection

Trust Pilot Score 4.7/5
⭐ ⭐ ⭐ ⭐ ⭐
 
NZDUSD, an upward correction in the asset is intensifying


The NZD/USD pair corrects within an uptrend, trading near the level of 0.6717.

Today it became known that the renewed version of the free trade agreement with China will finally enter into force on April 7, 2022. Also to the main points, the new document pays great attention to the regulation in e-commerce and environmental protection. This Wednesday, the Reserve Bank of New Zealand will hold its regular meeting on monetary policy, and until this date, serious fluctuations in the national currency are not expected.

The USD Index is moving without pronounced dynamics around the level of 96. The situation in the US economy remains extremely uncertain, and the fact that the budget for 2022 has not yet been adopted speaks volumes. Yesterday, US President Joe Biden signed another project on temporary funding of the federal government until March 11, but the likelihood that the budget will be adopted before that time is small. As for macroeconomic statistics, the January report on sales in the secondary housing market surprised investors. Net sales rose for December, and the sales index was 6.7%, with an expected decline of 1.0%.

Support and resistance
The asset moves within the global downtrend, correcting upwards within the local wave. Technical indicators maintain a weakening global sell signal: fast EMAs on the Alligator indicator are approaching the signal line, and the AO oscillator histogram forms upward bars in the sell zone.

Resistance levels: 0.6742, 0.686.
Support levels: 0.6679, 0.659.

nzdusd_1.png

Solid ECN Securities
1:1000 Leverage | Spread from Zero | %40 Deposit Bonus | Negative Balance Protection
 
Market update by Solid ECN Securities


Nasdaq 100, correction in the bond market puts pressure on the index.
At the moment, the Nasdaq 100 quotes are showing a downtrend against the background of the ongoing correction in the bond market, trading at around 14000.

The day before, analysts at JPMorgan Chase & Co. in their 2022 forecasts, announced a projected possible 10% drop in revenue for the financial markets division in Q1. According to the company, the geopolitical pressure on financial markets is now so great that the risks far exceed the possible income.

The downward correction in the US bond market also continues. The yield on 10-year Treasuries has declined since Thursday, and the downtrend continues. Conservative 20-year bonds are also declining rapidly.

Support and resistance
Index quotes are traded as part of a correction to the global uptrend, declining as part of a local wave. Technical indicators are in a quite strong sell signal state: the range of EMA fluctuations on the Alligator indicator is wide enough and the AO oscillator histogram, trading in the sales area, is actively forming descending bars.

Support levels: 13800, 13000.
Resistance levels: 14430, 15150.​

nq100.png
 
GBPUSD market insight by Solid ECN Securities


The pound is consolidating near 1.36.
The British pound is trading ambiguously against the US dollar during today's morning session, consolidating near 1.36. Despite the fact that the British currency has been trying to renew local highs since the end of January, the further growth of the instrument was limited by the aggravation of the geopolitical situation around Ukraine.

The day before, the President of Russia signed a decree recognizing the independence of the Donetsk People's Republic (DPR) and the Lugansk People's Republic (LPR), and also instructed the Ministry of Defense to ensure the safety of citizens in these territories. The vast majority of Western countries have already spoken out condemning these actions, and the head of the White House, Joe Biden, signed a decree imposing new sanctions against Russia.

At the same time, the UK macroeconomic report released the day before provided significant support to the pound. Markit Manufacturing PMI in February remained at the same level, while analysts expected it to decline. Markit Services PMI in February strengthened ahead of its forecasts.

Support and resistance
In the D1 chart, Bollinger Bands are reversing horizontally. The price range is changing slightly, but remains rather spacious for the current level of activity in the market. MACD indicator is trying to reverse into the descending plane, keeping the previous buy signal. Stochastic, having approached the level of "80" is also inclined to reverse downwards, indicating the possibility of a corrective downtrend in the ultra-short term.

Resistance levels: 1.36, 1.365, 1.37, 1.375.
Support levels: 1.355, 1.3500, 1.3460, 1.3435.​
 

Attachments

  • gbpusd_1.png
    gbpusd_1.png
    27.9 KB · Views: 40
  • gbpusd_2.png
    gbpusd_2.png
    27.6 KB · Views: 41
Top