SOLIDECN
Senior member
- Messages
- 3,041
- Likes
- 0
Market update by Solid ECN
EURUSD holds at record lows
The pressure on the position of the trading instrument is still exerted by the growing geopolitical tension in Eastern Europe Negotiations aimed at an immediate ceasefire, which the parties tried to hold at the end of February, did not lead to any results, and Russian troops continue to conduct a special military operation on the territory of Ukraine. In the meantime, the Russian economy is facing unprecedented pressure from sanctions, which has some counter-effect.
Macroeconomic statistics from Europe published yesterday turned out to be mixed.
The statistics on business activity showed a slight decline, but the February data does not yet include such a sharp deterioration in the situation in Eastern Europe. Anyway, the Markit Manufacturing PMI in the euro area in February fell, while analysts did not expect any changes at all. But statistics on inflation in Germany supported the position of the euro. The Harmonized Price Index increased by 5.5%, beating forecasts of a 5.4% increase.
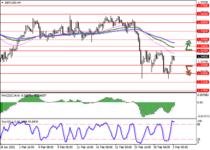
Support and resistance
Bollinger Bands in D1 chart demonstrate active decrease. The price range is expanding, but at the moment it is not keeping up with the surge of "bearish" sentiment. MACD is going down preserving a stable sell signal. Stochastic is showing similar dynamics; however, the indicator is rapidly approaching its lows, indicating the risks of oversold EUR in the ultra-short term.
Resistance levels: 1.115, 1.1185, 1.1220, 1.1255.
Support levels: 1.11, 1.1054, 1.1, 1.0952.