You are using an out of date browser. It may not display this or other websites correctly.
You should upgrade or use an alternative browser.
You should upgrade or use an alternative browser.
- Status
- Not open for further replies.
Gring0
Well-known member
- Messages
- 264
- Likes
- 128
Gring0
Well-known member
- Messages
- 264
- Likes
- 128
For NQ price is in a TR. The short seemed like triggering yesterday but by the end of the day price was back and didn't continue. With TR clear it's a bit easier to stay focused. I also use hourly when price is 'closer' to a clear potential R or S instead of always following it mechanically (which as Db has shown also is a viable strategy). In other words, I only look at daily and when daily shows an interesting level then the hourly or smaller bar interval becomes the focus of attention.
When things get a bit turbulent I prefer to take a step back and clarity of consensus to emerge. These violent up and own moves show that the large operators are also not on the same page as far as direction is concerned. Those who surf these waves can't surf unless the wave has a proper form and direction. I wait for the size and direction to align. Size by looking at the daily and important levels, and form by using SLA or AMT to enter.
4355 or thereabouts is a reasonable area to keep an eye on. It helps us control our risk. When risk is managed the rest is quite mechanical.
Gringo
p.s For technical purposes the hourly is a short based on SLA. If those reading it can't see it then they need to pay attention to why their eye can't see it. I would add with shame here that SLA has over the course beaten my analysis quite handily!
Attachments
Last edited:
dbphoenix
Guest Author
- Messages
- 6,954
- Likes
- 1,266
These violent up and own moves show that the large operators are also not on the same page as far as direction is concerned.
Which may account for the waffling about the halfway level of the Nov-Feb downdraft ( 4282 +/-), which isn't much different from the middle of this TR that began last week (4293). Those who focus on looking for trades rather than understanding what The Money is doing and why it's doing it can spend an awful lot of time in chop. Fortunately, the SLA, if the rules are followed, prevents that.
Db
dbphoenix
Guest Author
- Messages
- 6,954
- Likes
- 1,266
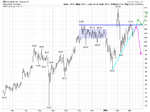
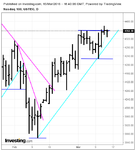
This morning provided a good example of the sort of accumulative/distributive base I address in The Burrow.
Note how tight this is over its 90m length. Note how volume either dries up as price approaches one side or the other or, if somewhat heavier, that the approach fails and price reverses immediately. The Money, in other words, is keeping price within this range.
Note also that the majority of the trades are taking place in the top half of this range. This tilts the probability of an upmove to the plus side. And as Wyckoff didn't like buying BOs, one of his "stealth" entries can be placed just above 34.5 as this level has been tested three times by then (during the same period, 33.5 has been tested five times, but the probabilities favor the upside, and 33.5 may suggest support).
Attachments
dbphoenix
Guest Author
- Messages
- 6,954
- Likes
- 1,266
Gring0
Well-known member
- Messages
- 264
- Likes
- 128
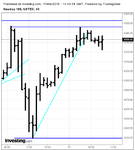
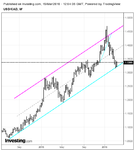
Usd/cad fx
FX is not always mean reverting-enough but doesn't harm to at least keep an eye on what is happening.
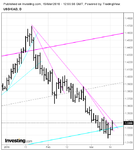
USD/CAD Weekly: Price around oversold line of the rising TC.
USD/CAD Daily: SL breached (notice the tighter one).
Gringo
FX is not always mean reverting-enough but doesn't harm to at least keep an eye on what is happening.
USD/CAD Weekly: Price around oversold line of the rising TC.
USD/CAD Daily: SL breached (notice the tighter one).
Gringo
Attachments
Gring0
Well-known member
- Messages
- 264
- Likes
- 128
This retracement back to the top of the TR looks like a gimme. But looks can sometimes be deceiving.
Are you referring to the daily or the hourly interval?
Gringo
Are you referring to the daily or the hourly interval?
Gringo
Hourly
dbphoenix
Guest Author
- Messages
- 6,954
- Likes
- 1,266
I've been asked about comparing the NQ with the ES and the Dow with regard to the above chart. Rather than spend a lot of time with weekly and daily and hourly and intraday comparisons, I'll say instead thatThe SLA will “work” in any auction market, i.e., any market that moves according to the law of supply and demand. However, the swings in some markets are much wilder than the swings in others. Some markets gap more than others. Some markets sit and do nothing for far longer than others, wearing out those who don’t have the patience to wait it out.
There is also the matter of the trader and his timeframe (generally some number of weeks or days) and the bar interval he likes to trade (though this will be determined in part by whether or not he has the time to watch price move; if he doesn’t, anything less than an hourly interval will be difficult to impossible to manage).
The general objective, however, is to find an instrument that is simple to trade, easy to trade, that is “directional”, that moves smoothly, that moves with ”intent” (i.e., that is decisive after reversals and breakouts), that chops as little as possible, and is, of course, liquid.
Avoiding gaps pretty much eliminates stocks. Trading outside regular market hours generally means futures. The S&P is the most popular stock-index market and the ES is therefore the most popular futures market. However, that popularity means that the S&P and the ES are the first choice of program trading arbitrageurs. The practical consequence of this is that there will be lots of sideways movement, lots of back-and-fill, lots of congestion. For many traders, particularly small retail traders, this means scalping for ticks, and doing so alongside professionals, including HFTs, who are in a much better position to make a success of it. The small retail trader is in effect wearing a sign on his back that says “Kick Me”.
This is not to say that the ES never goes anywhere. How a particular futures instrument moves depends largely on its underlying. Dow futures are based on 30 stocks. The NQ is based on 100. The ES is based on 500. So Newton’s First Law of Motion becomes a factor (a body at rest tends to remain that way). There is also the character of the underlying to consider. The NQ is essentially technology; it has for example no financials. The ES, however, incorporates nine sectors, including financials and industrials. It will move differently. Whether that differently is better or worse depends on the trader’s objectives.
When all is said and done, however, money is made when price moves directionally, and the more directional the instrument is, the more money there is to be made with it. Trade costs are also far less given that the number of trades is far less. And while I understand how nationalism prompts one to look in his own backyard for instruments to trade, chauvinism should not prevent the trader from looking for whatever gives the most bang for the buck. Nor need hours of operation be a factor. The NQ, for example, for whatever reason, has been waking up around 0300 NYT for a while and the moves it makes before the regular market opens can be not only easy but profitable, e.g., that 50pt move yesterday morning beginning at 0430 (0930 in London, 1030 in Berlin, 1230 in Delhi). There are also those pre-market reports to take advantage of, such as NFP.
If the trader, then, finds that the SLA -- or any other method -- is not providing the expected results, he should perhaps, rather than search for another method, explore other instruments and even other markets.
Db
dbphoenix
Guest Author
- Messages
- 6,954
- Likes
- 1,266
1. Track the balances between supply and demand with straight lines along swing points, swing lows if price is rising, swing highs if it’s falling. If price is ranging (moving sideways), your lines will be lateral.
2. When price breaks a line, exit. If it was trending and takes off in the opposite direction (a reversal), or if it was ranging and breaks out of that range (a breakout), wait for a pullback (a retracement).
3. Enter on that retracement, a few ticks above the trough of a \/ retracement or a few ticks below the crest of a /\ retracement, and stay in until your line is broken. And by "broken" I don't mean that price just pokes the line. As long as buyers are in charge , stay long. If sellers are in charge, stay short.
4. When the line is broken, exit and wait for a retracement in the opposite direction.
5. Continue until you enter chop (two consecutive trades that don't go anywhere and are accompanied by a higher low and a lower high, i.e., not trending.
6. Wait patiently. Quit when you get tired and start to lose focus.
Given the number of lurkers and guests,
the rules, illustrated:
Attachments
db, I have a couple of questions I'd appreciate your input on:
1. I roll from one NQ contract to the next manually, based on volume, without back adjustment (so as not to disturb prior existing horizontal levels I find helpful). Is this the method you use, or would you suggest a different approach?
2. Something I am undecided about relates to entry at turning points (extremes), where the turn of price is accomplished in a very brief, volatile 'range'. I hesitate to call it a 'range' because if it was a normal range I would enter when price leaves the range. But I am referring to a brief passage of several bars that often test the low (or high), and uneven in their up and down movement. In this price action I am torn between: 1. Seeking entry as near the actual turn as possible; or 2. Waiting for price to clear the little volatile area ('range') and then seek entry as price breaks away.
Entry under method 1, if successful, may result in a 5 or 6 pt better price, give or take. What makes entry method 1 possible (to try) for me is stoping out very close to my point of entry if price does not move as anticipated (keeping the loss on that entry quite small - 1 to 3 ticks). You have described using an entry/stop technique in some circumstances that may be similar to this. This approach enables me to make two or three entries, if necessary, fairly inexpensively. However, it can be a bit trying to catch this entry properly.
Thanks in advance for your thoughts.
dbphoenix
Guest Author
- Messages
- 6,954
- Likes
- 1,266
1. I used to be anal about this, but as I developed a better appreciation for what support and resistance actually were, lines became less important, unless they were immediately-preceding range lines. And the difference between one contract and the next just wasn't that important either. As for volume, the SLA doesn't include it, so there's no need to concern oneself about it.
2. Get to know "Trading Opportunities", p. 60, "Please Sir", p. 103, and "What Am I Bid?", p. 125, to start. First you have to know where the TO is mostly likely to be, such as the upper or lower limit of the weekly trend channel. When price gets there, watch both daily and hourly charts simultaneously. When you switch from the daily to the hourly takes judgement, but I suggest letting the lines lead you as until they are broken, you risk getting caught in a game of Keep Away. Let The Money show its hand. If you can enter while everyone else is confused, you stand to do well. But the confusion works itself out fairly quickly, which is why price so often begins to drift around 1100.
You cannot know the "actual turn" in real time. If you're trading intraday and you're watching price move (if you're not watching price move, you have no business trading intraday), you can generally tell by the changes in activity and pace that something's afoot. You may often find springboards in tick charts. But you must also become very familiar with and comfortable with dogs (Appendix B). Note also that the first retracement is not always the cleanest. If you want a tight stop, the first RET may throw you out. Quite often it's the second RET that is the more capitulative.
This is all gurubabble, of course, without a specific example, which is what the book is all about. But the more examples, the better, so if you want to post something, feel free.
Db
Gring0
Well-known member
- Messages
- 264
- Likes
- 128
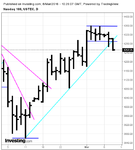
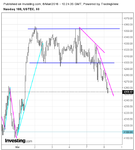
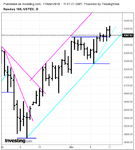
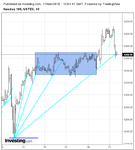
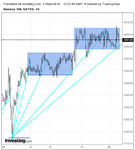
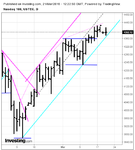
NQ Daily: Trend is still up. TC intact. SL are hunching over.
NQ Hourly: TR. Trend is still up. New DL.
Other than the hourly TR I don't see anything worth exploiting at this point. Using the weekly one can see price is above the median of the larger TR.
Gringo
NQ Hourly: TR. Trend is still up. New DL.
Other than the hourly TR I don't see anything worth exploiting at this point. Using the weekly one can see price is above the median of the larger TR.
Gringo
Attachments
1. I used to be anal about this, but as I developed a better appreciation for what support and resistance actually were, lines became less important, unless they were immediately-preceding range lines...
Db
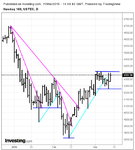
Thanks for these tips, db.
Is this an example of what you mean by a line that immediately precedes a range line? The idea being that relying on the line at extremes helps navigate chop that often occurs in these areas? Whereas at non-extremes, keeping track of swings, stride, retrace size, etc. allows for less strict adherence to lines?
Attachments
dbphoenix
Guest Author
- Messages
- 6,954
- Likes
- 1,266
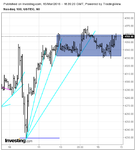
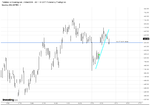
That's not what I had in mind. That to me is essentially directionless, which doesn't necessarily make it a rectangle. A tradeable rectangle for me is well-defined, e.g., the chart on the left below, which I was paying attention to because of what shaped up last Thursday and Friday, the chart to the right (also the high made at 0540).
Attachments
- Status
- Not open for further replies.