You are using an out of date browser. It may not display this or other websites correctly.
You should upgrade or use an alternative browser.
You should upgrade or use an alternative browser.
- Status
- Not open for further replies.
dbphoenix
Guest Author
- Messages
- 6,954
- Likes
- 1,266
I should point out that I used to make a distinction between range and rectangle (see the Burrow). But when I wrote the SLA, I didn't want people to think "pattern" and start looking for rectangles everywhere, the way some people find head-and-shoulders everywhere they look. Technically, as long as price is within the range set by the opening high and the opening low, it's range-bound. But that doesn't make it a rectangle, nor does it make it tradeable at low-risk. Once price reverses at the high then reverses again at the low -- or vice versa -- rather than trend, I tend to back off. If nothing appealing shows up by 1100, I quit.
Db
Db
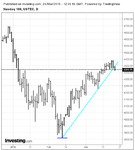
1. I used to be anal about this, but as I developed a better appreciation for what support and resistance actually were, lines became less important, unless they were immediately-preceding range lines. And the difference between one contract and the next just wasn't that important either. As for volume, the SLA doesn't include it, so there's no need to concern oneself about it.
2. Get to know "Trading Opportunities", p. 60, "Please Sir", p. 103, and "What Am I Bid?", p. 125, to start. First you have to know where the TO is mostly likely to be, such as the upper or lower limit of the weekly trend channel. When price gets there, watch both daily and hourly charts simultaneously. When you switch from the daily to the hourly takes judgement, but I suggest letting the lines lead you as until they are broken, you risk getting caught in a game of Keep Away. Let The Money show its hand. If you can enter while everyone else is confused, you stand to do well. But the confusion works itself out fairly quickly, which is why price so often begins to drift around 1100.
You cannot know the "actual turn" in real time. If you're trading intraday and you're watching price move (if you're not watching price move, you have no business trading intraday), you can generally tell by the changes in activity and pace that something's afoot. You may often find springboards in tick charts. But you must also become very familiar with and comfortable with dogs (Appendix B). Note also that the first retracement is not always the cleanest. If you want a tight stop, the first RET may throw you out. Quite often it's the second RET that is the more capitulative.
This is all gurubabble, of course, without a specific example, which is what the book is all about. But the more examples, the better, so if you want to post something, feel free.
Db
I've read those sections in the past (though in the materials you emailed to me they are located on different pages: Trading Opportunities is p. 49; Please Sir is p. 87; What Am I Bid? is p. 125 - perhaps you've come out with a revised/expanded edition?). And I've read The Dog That Didn't Bark as well (Appendix B in my version as well).
I trade intraday only; trading chart is a 1023 tick chart; 1 hr chart is used throughout the day.
My questions really just went to the mechanic of the roll - there are different ways of doing it. I take it you do it much as I do; and to your thoughts regarding the quick entry/stop method for early entry versus waiting for the dust to clear.
Thanks again.
Ged
dbphoenix
Guest Author
- Messages
- 6,954
- Likes
- 1,266
and to your thoughts regarding the quick entry/stop method for early entry versus waiting for the dust to clear.
Thanks again.
Ged
It's not so much early entry as entering when the market tells me to, but to see that I need something much smaller than a thousand ticks.
Db
It's not so much early entry as entering when the market tells me to, but to see that I need something much smaller than a thousand ticks.
Db
Every tick is visible in a 1023 chart. I also have a one minute chart up. I've played with the 15 and 20 second type charts, but I don't find them greatly more useful. As long as I can see what price is doing on the right side of my bar, tick by tick, it works.
dbphoenix
Guest Author
- Messages
- 6,954
- Likes
- 1,266
Every tick is visible in a 1023 chart. I also have a one minute chart up. I've played with the 15 and 20 second type charts, but I don't find them greatly more useful. As long as I can see what price is doing on the right side of my bar, tick by tick, it works.
Every tick is visible in any kind of chart if one follows the hash mark up and down. But there is no record of its progress unless one drops to a lower interval. And time is important in re trading the SLA intraday.
For example, from yesterday:
Attachments
Gring0
Well-known member
- Messages
- 264
- Likes
- 128
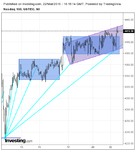
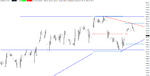
Or one can revisit the roots of the SLA and plot a Wyckoff perspective:
Much much better. Cleaner and less overwhelming. :clap:
Gringo
dbphoenix
Guest Author
- Messages
- 6,954
- Likes
- 1,266
Judge the market by its own action. If one opts out of a trade simply because of what he thinks might be resistance somewhere "up there", he won't be making many trades.
Support and resistance are continually dynamic. They are not found in software or indicators.
Support and resistance are continually dynamic. They are not found in software or indicators.
Attachments
dbphoenix
Guest Author
- Messages
- 6,954
- Likes
- 1,266
With regard to a discussion that's going on in the other thread, and because the pdf doesn't address volume and the book does, I'm posting this here:
Attachments
dbphoenix
Guest Author
- Messages
- 6,954
- Likes
- 1,266
For European traders, there was another trade earlier that day at 0930, London time. Given that activity is so much less at that hour, it's generally not necessary to drop below a 1m interval.
Note the heavy activity at 0430. The result, however, was null, and it was all over in seconds.
Note the heavy activity at 0430. The result, however, was null, and it was all over in seconds.
Attachments
Gring0
Well-known member
- Messages
- 264
- Likes
- 128
dbphoenix
Guest Author
- Messages
- 6,954
- Likes
- 1,266
I thought today looked familiar (the right side chart):
http://www.trade2win.com/boards/trading-journals/209844-slayers-notes-62.html#post2723728
http://www.trade2win.com/boards/trading-journals/209844-slayers-notes-62.html#post2723728
dbphoenix
Guest Author
- Messages
- 6,954
- Likes
- 1,266
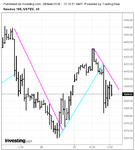
Pre-market range from 4377.25 to 4384.
Failure to BO to the upside at 0935.
Failure to BO to the downside at 0937.
These failures result in LHs and HLs: a hinge.
Price BO to the downside at 0950. No short RETs.
Price REV and BO to the upside at 0957. Long RET at 0959. Buy.
One trade.
Db
Failure to BO to the upside at 0935.
Failure to BO to the downside at 0937.
These failures result in LHs and HLs: a hinge.
Price BO to the downside at 0950. No short RETs.
Price REV and BO to the upside at 0957. Long RET at 0959. Buy.
One trade.
Db

dbphoenix
Guest Author
- Messages
- 6,954
- Likes
- 1,266
As Douglas would say, one need not have any idea what's going to happen next in order to make money. All one has to do is develop a consistently-profitable trading system and trade it. Price targets, risk:reward ratios, and winrates are irrelevant.
Db
Db
Attachments
- Status
- Not open for further replies.