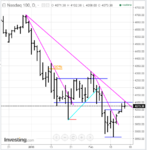
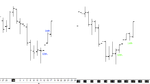
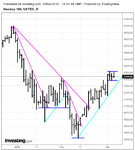
It amazes me again and again how these level work...
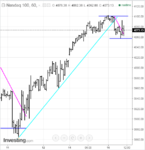
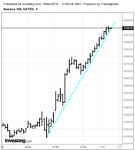
When price hit the range low early during the EU morning, there was the opportunity to go long with a potential level above to test - the midpoint of the hinge, where it just turned and offered another opportunity.
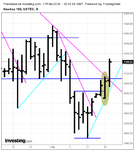
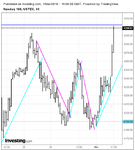
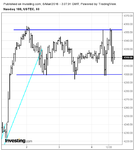
It seems that I have no problems to locate these levels, but specially if it comes down to reversals in ranges, I have a bit of trouble to trade them. Even if they very often offer the best opportunities. For sure the 5sec comes in handy here - and trust in AMT...

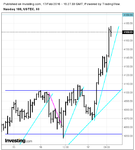
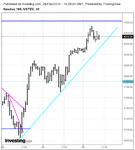
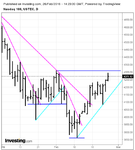
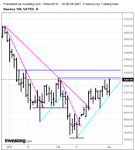
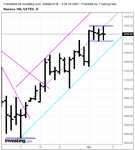
When price hit the range low early during the EU morning, there was the opportunity to go long with a potential level above to test - the midpoint of the hinge, where it just turned and offered another opportunity.
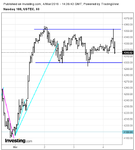
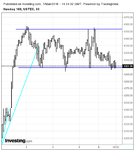
It seems that I have no problems to locate these levels, but specially if it comes down to reversals in ranges, I have a bit of trouble to trade them. Even if they very often offer the best opportunities. For sure the 5sec comes in handy here - and trust in AMT...