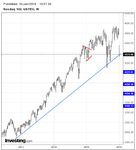
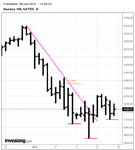
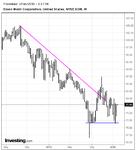
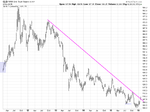
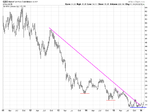
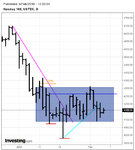
SLAyers' Notes

Status
Not open for further replies.
Noticed Friday's volume is very weak for such a strong up bar and today looks even weaker. Short covering? Big money on the sidelines?

Low volume means low intensity. Price is rising without much resistance from supply. Whether this means the rise is dubious or whether the supply is exhausted, we really won't know until the hand is shown to us by the movement of the price itself. What we don't know is WHEN the supply is going to exert itself. Lack of volume doesn't give us the when. It's the when that makes us money.

Gringo
 
NQ Weekly: Bounce around S and lower TL. Another lower TL still a ways down.
NQ Daily: RET
NQ Hourly: Bounce off the median of TR. SL breach. Back above TR.

Gringo
 

Attachments

  • NQWeekly.png
    NQWeekly.png
    30.2 KB · Views: 125
  • NQ Daily.png
    NQ Daily.png
    27.4 KB · Views: 149
  • NQ Hourly.png
    NQ Hourly.png
    36.2 KB · Views: 126
NQ Daily: RET
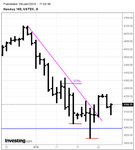
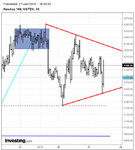
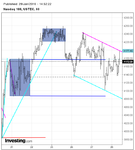
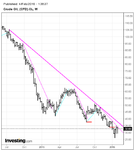
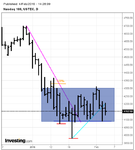
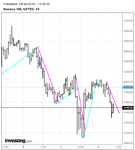
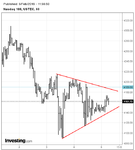
NQ Hourly: Possible TC downwards. Movement is erratic, more like being in a TR.

Analysis: Daily is clear as price is retracing. A long entry might come if price fails to continue down and shows strength. In case of drop the previous swing low is a marker. Lower then that we're back to down trend being confirmed after a bit of a rest stop. Hourly is quite a mess. Because of the trend being a bit unclear it is under these circumstances that SLA can give multiple quicker exists. That's why the focus on aligning the weekly/daily/hourly is emphasized.

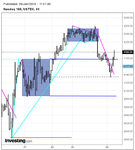
As an example, if daily starts getting close to giving a long signal based on SLA, then using the hourly or smaller bar interval using SLA again would likely give a better entry. All depends on how much time one has to spare. These are interesting times as price could potentially change the downtrend and head upwards.

Changes in trend are tricky in the sense that our mental makeup at times wants to interfere with the our signals. Our perceptions of what market is doing gets disconnected from what the market actually is doing and how the price is behaving.

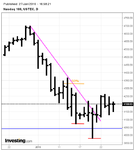
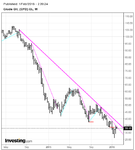
When price was up around 4700, it wasn't easy to just short there. In hindsight it all looks rosy. In reality there was always this possibility of price making a new high and continuing upwards, something it had done countless times before. It's under these conditions that adhering to SLA-AMT comes in very handy. Once the confusion is no more due to the identification of a danger point (risk control), one is less prone to getting paralysis from analysis. This last paragraphs is to highlight that mental makeup and psychology play a vital, perhaps most important role in our speculative endeavors.

“I think investment psychology is by far the more important element, followed by risk control, with the least important consideration being the question of where you buy and sell.” - Tom Basso

Happy Trading

Gringo
 

Attachments

  • NQ Hourly.png
    NQ Hourly.png
    35.2 KB · Views: 129
  • NQ Daily.png
    NQ Daily.png
    27.6 KB · Views: 120
Last edited:
I don't know that I would call the hourly a mess. Whether or not one is even trading the hourly would depend on whether or not he exited the daily short. If he exited it without having determined how far price can break the line without staging a continuation, he'd likely be out on the 20th. The RET for the long occurs the next day. He'd be out of this on the 24th or 25th and re-enter a short afterward, either shorting a retracement or shorting the double top (the swing high on the 24th is 60; on the 25th, it's 59.75). Even if he were to exit the short on the 26th, he'd be back in the same day.

All this is of course predicated on the use of danger points and on a more thorough understanding of the interaction between demand and supply. If the beginner cannot yet detect the turning points in the demand/supply balance in real time, then the SLA will be a tangle of lines that provide little to no guidance whatsoever.

Db
 
4200 on daily has a meaning. The daily crowd sees it too.

Gringo

Looks like I'm going to have to add something about tells.

Db

Edit: Incidentally, for those who are trading the daily chart, or at least thinking about it, the long entry was triggered at the NY open. Now it's a matter of waiting to see if the RET is confirmed. (And this is not a question of hindsight trading but of following the rules.)
 
Last edited:
Looks like I'm going to have to add something about tells.

Db

My kid has started to sits with me two times a day when I ask him questions about the market. Although his understanding is limited to SLA-AMT (and still not solid) he was able to tell me today before getting ready for school that 4200 looked important and if price went above it the daily might be a buy. He still has trouble seeing price as being continuous but observation is going to come next. Db's illustrations with entry and exits, especially the concept of DL/SL breaks, RET or its failure seem to be taking root. He's not aware of what futures are, and for now only sees price as it bobs up and down.

Gringo
 
My kid has started to sits with me two times a day when I ask him questions about the market. Although his understanding is limited to SLA-AMT (and still not solid) he was able to tell me today before getting ready for school that 4200 looked important and if price went above it the daily might be a buy. He still has trouble seeing price as being continuous but observation is going to come next. Db's illustrations with entry and exits, especially the concept of DL/SL breaks, RET or its failure seem to be taking root. He's not aware of what futures are. Only sees price as it bobs up and down.

Gringo

Might he understand the "Continuity of Price" tutorial on p. 21? There's also the stuff on tick charts on p. 13.

Db
 
Might he understand the "Continuity of Price" tutorial on p. 21? There's also the stuff on tick charts on p. 13.

Db

Yes, I'll go through "Continuity of Price for Beginners" again and then guide him through it. His only exposure is the older and compact SLA-AMT and I hadn't dared to venture too far from it. Now that I see some progress I'll slowly increase the exposure.

I noticed when bars changed to line he got confused. But it could be my fault not introducing him to different kinds ways to display price. I'll be setting up re-plays for him to get the feel of how price moves. So far it's been mainly hidden static bars that I unravel using the scroll. He does seem to have a knack for figuring out the dogs, which gives me hope that there is hope.

Gringo
 
Last edited:
I noticed when bars changed to line he got confused. But it could be my fault not introducing him to different kinds ways to display price. I'll be setting up re-plays for him to get the feel of how price moves.

Gringo

You may also want to show him the tick charts first.

Db
 
This Is the Oil Stock to Own Now

The Wall Street Journal

In this week's episode of the Heard on the Street podcast, we discuss why shares of Exxon Mobil could be the best way to play oil's slide . . .


Apparently they've been reading our posts . . .

Db
 
Oil and XOM Weekly

Oil Weekly and XOM weekly. Notice how XOM has had SL break and a LH. Oil is still in a down trend. When the fortunes of oil change there is likelihood of XOM propelling upwards.

Db has pointed out the star under duress. It's up to us to be alert when the clouds clear and the start rears its head to light the path.

Gringo

P.S. A reminder that oil is in a DOWN trend and the SL has not been breached. Human mind has a habit of disregarding information that's contrary to our beliefs. Just because XOM is showing strength doesn't mean the power of the rising tide is behind it, yet. Until SL breach and a RET and a rise, oil shall remain in a down trend (V reversals excepted) according to our SLA-AMT rules.
 

Attachments

  • Oil Weekly.png
    Oil Weekly.png
    34.4 KB · Views: 136
  • XOM Weekly.png
    XOM Weekly.png
    29.8 KB · Views: 128
Last edited:
I love the lines. Exit on time. Entry on time. Risk minimal. Reward reasonable. Edge holds. I play as the house.

Gringo
 
Gold, Gold Miners, Gold Stocks

I have been looking at gold and used Db's stated method of going into a sector and then identifying stronger stocks. Gold futures are in a down trend. Gold miners on the other hand seem to resist downward movement and actually may be in the process of starting a run up (speculation on my part). The probabilities for gold miners to me seem like pointing upwards. This is all using the standard SLA-AMT analysis of course and for those who have bothered to read this thread shouldn't find it to be too complicated.

I'll let the charts do the talking. It's to get us focused on something that might be flying under the radar amid all this doom and gloom of the oil.

Gringo
 

Attachments

  • Oil Weekly.png
    Oil Weekly.png
    34.1 KB · Views: 141
  • DRD Weekly.png
    DRD Weekly.png
    17 KB · Views: 134
  • HMY Weekly.png
    HMY Weekly.png
    17.3 KB · Views: 120
  • GLD Weekly.png
    GLD Weekly.png
    18.3 KB · Views: 136
  • GDX Weekly.png
    GDX Weekly.png
    17.2 KB · Views: 125
Last edited:
NQ Daily. TR. Price isn't at an extreme yet.
NQ Hourly: Trending down but away from optimal entry point.
Analysis: Nothing to do until an extreme is reached.

Gringo
 

Attachments

  • NQ Daily1.png
    NQ Daily1.png
    28.9 KB · Views: 143
  • NQ Hourly.png
    NQ Hourly.png
    30.1 KB · Views: 145
NQ Daily: TR. RET.
NQ Hourly: Hinge. Reaching the last 1/3rd.
Analysis: Sit pat.

Gringo
 

Attachments

  • NQ Daily.png
    NQ Daily.png
    29.1 KB · Views: 133
  • NQ Hourly.png
    NQ Hourly.png
    26.8 KB · Views: 158
I posted the chart on the left in the SLA thread on Saturday. But as you guys have the book, "Please Sir" and "What Am I Bid" in Notes may be a bit clearer given this action; even if you're trading the hourly, never forget that it's the longer-term people who've got the money to move the market. Stay in touch with them. Watch what they do. Don't argue.

Edit: Watch the September low.
 

Attachments

  • Update Dly 0208.gif
    Update Dly 0208.gif
    47.9 KB · Views: 191
Last edited:
If there is confusion regarding where to enter the above trade, a sell stop placed at the red dot will be triggered the following day (this is assuming that one isn't watching the chart; if one is watching the chart, then he's in a position to trade a smaller interval). If for some reason the trader doesn't want to use a sell stop, he can enter at the first retracement on the hourly or anywhere in the next retracement.

The cue is taken off the daily. The entry may be taken off the daily or the hourly. Trader's choice, depending on how much time he has to devote to this and if he is available when the time comes to make a decision.
 

Attachments

  • Update Dly 0208a.gif
    Update Dly 0208a.gif
    19.6 KB · Views: 197
Status
Not open for further replies.
Top