SLAyers' Notes

Status
Not open for further replies.
Interesting, Kleft, how you overlay the hourly on top of the five minute to create context. A question...

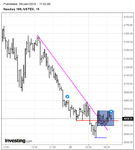
I see how a bounce off the hourly hinge SL and the 2nd failure (at 0650) to breach the last swing high (made at 0315) on the five minute would help make a case for taking these shorts. But what does price being within the second narrower range (green area on the 5 min chart) mean for taking the first short? Does DT stand for Danger something? Territory? If so, wouldn’t you have waited for price to exit out of it before entering? Or maybe you thought price was headed in the right direction as a result of the failures, and therefore felt confident enough to get in “early,” i.e., before leaving the green zone and before a break of the tightest trend line. (I'm guessing you would have drawn the median line through the range if the entry had to do with bouncing off it.)

Being in the UK I am in a position to look at the overnight goings on whilst they are still going on provided I can crawl out of my pit at an appropriate time.

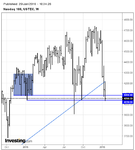
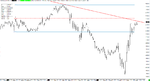
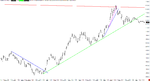
In this instance I missed the 03:15 high but noticed that price had recoiled 29 points from this level and was tentatively creeping back. I had a look to the left and saw that the hourly had a 5 hour range during the drop, there is a chance that former ranges can exert an influence on future price movements and in particular the mean, I'm not entirely sure how much credit to give it as it was an overnight range but, nevertheless price sat there for 5 hours so it might mean something.

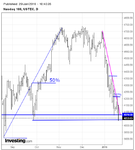
Getting back to the line of thought, DT stands for double top, price is creeping back to the 3:15 highs the drop from which stood out, traders were unwilling or unable to take price higher and the same reason might still exist once price returns again. Double tops and bottoms can mark extremes from which price can make some of its stronger moves, if I see price return to a swing point that has had a strong reaction I look at the behaviour on a low time frame to see if it is lining up a repeat performance.

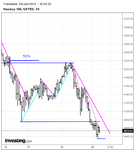
The green just highlights where the range is as I cant see it on a 5 min chart and I knew that the first high was around the mean so felt no need to draw in the mean, the short is taken on the behaviour DT at the mean of the range (price might also struggle here) with the hourly SL giving context, three things all of which could call for action on their own.

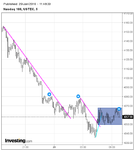
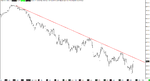
If one was being super tight with their DL's a tighter one existed on the 1 minute that would have had one short at around 07:09 or 07:16 at around 4208 the 07:52 high might have pushed some out but if the DP's were left in place you'd be up 20 by the time the bell rings, if you're available of course.
 
Last edited:
I suspect that the only traders who continue to go on about how meaningless the overnight activity is are amateurs. It is as if, to them, NY is the only market that counts. But surely by now enough traders have noted the dramatic moves at 0300 and 0400 that the light has begun to dawn of the importance of Europe and the Far East. And I suspect that there are those in Europe and the Far East who understand how simple and profitable it is to trade the NQ (a plurality of SLAyers are in the Far East).

As far as former ranges having an effect, particularly in larger intervals, yes. That is the thrust of what I try to convey in "Please Sir" and "Bid". Otherwise the turn at the hourly SL would be completely random.

He needn't have waited, and, obviously, not everyone did, hence the first effort. But he was available for the second try, and this time the hourly people were behind him. When he sees the DT, he can then place his sellstop below all this. If price falls, he''s stopped in. If instead it breaks through and tries to achieve a change in stride, his trade is never triggered. The only occasion for nail-biting is the wait to find out if the RET is confirmed or not, and this is where the "Price of Admissio" enters into it. When the RET is confirmed a half hour later, he can draw his first SL. Ditto for each subsequent RET and confirmation and SL.

This is the payoff for all the observation and study and experimentation and why Kleft is where he is. Those who see no point in observation etc will find themselves in a perpetual state of couldawouldashoulda.

I should also point out that this is what some people pay twelve thousand dollars to learn how to do. And Kleft has learned it for nothing.

Db
 
Weekly, daily, and hourly are all showing some kind of potential support around 4040 (4035 is LSL on hourly) area. Below that it's not so clear where any potential support might turn up. Around 3990s or 3900 (climax low on daily) perhaps, but nothing I could figure out. So far all three bar intervals are pointing down. The fist to turn will be hourly, then daily, and then weekly respectively, in case there's a change in trend.

As has been talked about in the few posts above, the optimal entries are coming at timing more suitable for European or Asian traders. Those stuck on QQQ or other instruments have to remain patient and ready. The best thing is that the lines are down and the entry for a long never came. So unless one's trading intra-day it would be tough to lose money following the SLA.

AMT has also been working consistently. I notice on most mornings for intra-day if one's ready, the entry does come almost precisely at premarket TR or highs and low and all one has to do is have the gumption to take the trade. Although, at times this entry comes when some of us in North America are in beds.

Gringo
 

Attachments

  • NQ Weekly.png
    NQ Weekly.png
    27 KB · Views: 154
  • NQ Daily.png
    NQ Daily.png
    35.2 KB · Views: 157
  • NQ Hourly.png
    NQ Hourly.png
    32.5 KB · Views: 167
Last edited:
The entry on the REV of course was at 0435. 5m RET at 0515 that hasn't been confirmed. I was asleep at the time, but hitting S within 5pts was impressive. So we'll see what The Money does to push price one way or the other. Given yesterday's move, I wouldn't be surprised to see a sideways day, so it's important to know what to look for.

Db

PS This is pretty much the same "setup" I illustrated in post 25 in the SLA thread yesterday.

Zooming into to 5 min shows more clearly what's being cooked within. So far price is in a smaller range. Though this is too small of an interval for me to pay attention to until maybe close to the open. I have added the 15 min to have it all the way from weekly to 5 min. The possibility of the day to have the potential for ranging had escaped my mind.

Gringo
 

Attachments

  • NQ 05 min.png
    NQ 05 min.png
    29.2 KB · Views: 126
  • NQ15min.png
    NQ15min.png
    28.3 KB · Views: 121
BO and return to the apex of the hinge, then an aborted effort to move higher. Now we explore the other side.

Db
 
I desire to buy and am anticipating a bottom. The price on the other hand is acting weak swing after swing. Was busy today so couldn't join the shorts on intra-day basis but the hourly's been quite a stable friend.

On a brighter side my kid challenged me a bit with the trend. I said I was looking for a buying opportunity and he asked me why as the trend was clearly down. He stated the pink line is pointing down and price hasn't breached it yet. I said, yes, the daily is down but the hourly might be turning up, but then I held my tongue. I didn't want him to lose sight of the larger trend or get confused with minor things at this time. Inside, I was smiling. A 13 year old just by looking at lines figured this obvious thing out. Then I tested him with crude oil and in about a few seconds he said the trend was down there as well and down trend means you don't buy. Oh Db, these kids growing up challenging all these smart portfolio mangers who've been holding onto large losses probably, using just these simple lines. Little kid doesn't know what power he's gaining.

Gringo
 
Last edited:
Have you noticed that if you ignore all the threads having to do with forex that there's almost nothing left?

This is so much like '99 . . .
 
Have you noticed that if you ignore all the threads having to do with forex that there's almost nothing left?

This is so much like '99 . . .

I don't read anything other than your threads to so life's all clear from clutter. Why would people move towards forex en mass when markets are weak? Or is it move towards speculation due to the market moves?

This kind of weakness though must be new for some. It's been a long time since buying the dips caused pain. I am sure people out there are hurting. Day after day it's a hammering.

I looked at multiple RE indexes and all are showing weakness. This includes US, Canadian, and International. Maybe that time of the cycle is upon us, though it doesn't matter to those who trade like us. We change direction on a dime so bear or bull doesn't hold as much a sway in our cases. Now, if the RE market goes under then it's a global issue and that's when many may get pummeled.

Gringo
 

Attachments

  • Dow US Housing.png
    Dow US Housing.png
    8.6 KB · Views: 143
  • Canada Housing.png
    Canada Housing.png
    12 KB · Views: 131
  • Internatinoal Housing.png
    Internatinoal Housing.png
    13.9 KB · Views: 121
Why would people move towards forex en mass when markets are weak? Or is it move towards speculation due to the market moves?

The leverage. It's like a giant revolving door. And the new ones ask the same questions and make the same mistakes. And the beat goes on.

Db
 
Those who can draw a straight line would not have been surprised where the afternoon rally got halted.

In hindsight the high is also the MP of Mondays low and Tuesdays DT. The drop out below this range on Tuesday was not initially sustained by the close of the session which could give meaning to the LL, after the high, price could not maintain below Mondays low and has made for the SL a second time.

As an observation of the LL, when price initially broke down on Tuesday it behaved as if it was breaking from something important.
 

Attachments

  • nq2001201610min.png
    nq2001201610min.png
    36.3 KB · Views: 165
  • nq200120161min.png
    nq200120161min.png
    30.1 KB · Views: 148
  • nq2001201660min.png
    nq2001201660min.png
    29 KB · Views: 143
Interesting observations, and, yes, the drop out of that range on Tuesday did suggest something important. Doesn't really matter what, only that one make note of it. And make use of it if possible.

I don't go into a lot of analysis before I begin. I look at the daily and hourly to see how we got to where we are at the time, the picture, then look inside the hourly only at what's most immediately pertinent. So I wouldn't for example track back the 5m for an entire day. My focus this morning was the range in which price had confined itself prior to the open, as I posted in the other thread. Then there was the double top at the open, which one either took or didn't.

Otherwise, today provided excellent examples of what I've been talking about with regard to whom one is trading with. Throughout the day, it seemed obvious when one was trading with longer-term traders and when with scalpers, the bounce off 4000 being the most obvious example. But another obvious example came after the first retracement at 1315. Those taking it were trading with a different group of traders than those who were fussing with smaller intervals, which is one reason why it worked out. One might think of this as using the 5m, or whatever, as a "filter", to avoid "noise", but this misses the point. There is no noise, just as there is no noise in an orchestra. But there is also a melody, and it's the job of the trader to find the melody and stick close to it, doing his best to ignore distractions, like the asshole behind him who keeps kicking his seat (and there were all those hinges, or codas). Let the scalpers do what they will; at some point, the longer-term traders will pick up the thread and help to propel price. If the trader is paying attention and understands what's going on, he can use their help. If he isn't and he doesn't, then of course it all goes unnoticed.

Db

PS It may not matter at all, but note the relationship between yesterday afternoon's low and this morning's opening high. Probably just a coincidence, but . . .
 
I looked at multiple RE indexes and all are showing weakness. This includes US, Canadian, and International. Maybe that time of the cycle is upon us, though it doesn't matter to those who trade like us. We change direction on a dime so bear or bull doesn't hold as much a sway in our cases. Now, if the RE market goes under then it's a global issue and that's when many may get pummeled.

Gringo

I intended to say in response to this that one should also keep track of the sectors, only one of which is showing any sort of health. But apparently no one does that anymore, or knows how, or cares, or even knows that the sectors exist or what they are. But you'll remember that we used to do that, and even without the SLA, one would have to be a real dunce not to see market turns.

I find it interesting that the material in the Burrow gets no mention and no play, particularly with regard to stock selection. It's unfortunate that those who focus on that no longer have any place to discuss it. I was stunned the other day to discover that 50,000 people have downloaded the Wyckoff course. If even only one percent of those are using it and profiting from it, that is an extraordinary resource, completely untapped.

Db
 
Speaking of sectors and stocks (and all the nonsense that's being posted and published practically everywhere about oil) . . .
 

Attachments

  • Brent.gif
    Brent.gif
    47.5 KB · Views: 158
For grins, and as you all have the book and thus have something to refer to, let's play with O&G.

First, the group:
 

Attachments

  • FslFuGrp.gif
    FslFuGrp.gif
    27.4 KB · Views: 140
Then the subgroups:
 

Attachments

  • Trans.gif
    Trans.gif
    26.5 KB · Views: 125
  • Extr.gif
    Extr.gif
    27.8 KB · Views: 148
  • Svcs.gif
    Svcs.gif
    28.9 KB · Views: 169
  • O&G.gif
    O&G.gif
    28.1 KB · Views: 161
Then the major stocks in O&G:
 

Attachments

  • XOM.gif
    XOM.gif
    42.1 KB · Views: 214
  • CVX.gif
    CVX.gif
    42.3 KB · Views: 151
  • TOT.gif
    TOT.gif
    62.3 KB · Views: 178
  • COP.gif
    COP.gif
    41.3 KB · Views: 198
Now which of those do you suppose would make the best "indicator stock"?

Db

PS If you have no idea what I'm talking about, read "Stalking the Wild Equity" and "Bottom Fishing".
 
Last edited:
Now which of those do you suppose would make the best "indicator stock"?

Db

PS If you have no idea what I'm talking about, read "Stalking the Wild Equity" and "Bottom Fishing".

I'd say XOM to for the change in trend to the upside.

Gringo
 
Status
Not open for further replies.
Top