SLAyers' Notes

Status
Not open for further replies.
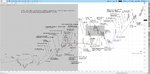
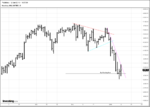
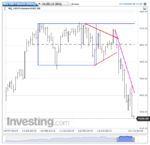
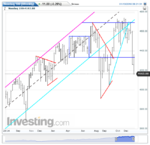
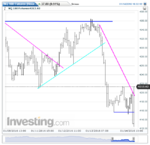
At db and Kleft’s suggestion, as an exercise I took real-time notes off the 1 minute chart Wednesday night and again Thursday morning, observing for about three hours in all. Attached are a chart and set of notes from each session. I wasn’t actually trading so the pressure was off in that sense. The only editing I did after-the-fact was for typos. The line colors are random. I welcome constructive criticism and/or enthusiastic praise, as warranted. Thanks.

manraygun,

What you are doing is encouraging. I would like to put in my 2 cents and hope that it helps you develop in the right direction. The first thing I would suggest is to at least put a number of the chart that corresponds with the comment or note you have written. Without the numbers it's a bit tedious to go through the chart and notes. For someone like me who has a full-time job this gets a bit too much.

This doesn't mean all I say is going to be valuable to you. I cannot fill Db's shoes while he's away, but all of us together may be able to at least help one another not go off track too much.

Good luck,

Gringo
 
Last edited:
Thanks for the gracious offer, Gringo. I'll number the comments or maybe put them right on the chart so one needn't go back and forth.
 
I'll second what Gring0 has said and will add my 2 cents for what it's worth.

Its good that you are picking up the manner in which the stride gets broken and how price moves around, is it hesitantly dipping its toe in the water or is it throwing itself in the deep end, understanding how price moves can give an insight into what could be around the corner.

A few of us went through the process at TL (DB has been housekeeping and the notes are MIA), DB encouraged us to post prep work 30 minutes prior to open which would highlight the most immediate obstacles and opportunities, you don't need to post that if you don't want to, but, if you have areas of interest note how price approaches these levels how it behaves at those levels and what it does once/if it passes beyond.

Thinking it was some kind of urban myth that one could get a feel for the market I resisted the idea of not trading whilst undertaking the task, eventually I stopped and just watched price, a few weeks of observing demystified a lot of PA that can cause one to become confused and tangled.

Even though you may not actually be trading there is still a little thought going into buying, selling, holding or exiting, observation is just watching without anything invested in the outcome.

If you are trading a 1 minute time frame come up for air now and again things can happen fast and one can become overly focused on individual bars and lose sight of the bigger picture, remember where price is coming from and heading towards tracking the balance between supply and demand and how the PA you are looking at plays into that.

The notes you are taking are good with some nice observations, keep it up.
 
I'll second what Gring0 has said and will add my 2 cents for what it's worth...

Thanks for your feedback and encouragement, Kleft. I appreciate your taking the time to look it over.

I too found/find it a little hard to believe that price can be anticipated (in particular the shorter intervals) but from what others say (and demonstrate) and from what I’ve seen with my own eyes it’s no doubt true. There is still a little nagging part of me though that wants to “keep score” with entries and exits in order to assure myself that it’s not all imaginary. At this point, I think I can let go of that and just observe for a while. Good idea.

What do you trade if I might ask? I see the last chart you posted was a five minute. I think your little formula “Location + behaviour = opportunity for profit” is pretty excellent btw.
 
Gringo and anyone else who's interested--
Here's one of the charts I posted earlier, this time with notes on board. Hopefully it will be easier to make sense of. Thanks.
 

Attachments

  • Session 2 chart with notes.jpg
    Session 2 chart with notes.jpg
    337.8 KB · Views: 261
What do you trade if I might ask? I see the last chart you posted was a five minute.

Like most following this I trade NQ, I look for areas that might mean something to higher time frame traders and use a 1 minute chart to track balance and initiate trades.

I've been playing with the 5 minute chart for managing trades as it can clean up the PA. I watched the unfolding action on the 1m chart of the 5m I posted and those pullbacks were a little messy, there was enough happening there for an eager trader to get chopped up on.

The 5 minute however is just swing highs, lows and midpoints until price gets to 50 which DB posted about where it got a kickback, price eventually went higher and this is where the coming up for air comes in.

The continuations got progressively weaker and the pullbacks deeper, then we dog at 60 then DT, if one is sucked into the 1m the importance of that close to an area that means something (50) might be missed.

How does price approach, what does it do when it gets there, and how does it behave if it passes.
 
Last edited:
I agree with Kleft. I use 1 min to enter when price very close to a potential s/r. After that I usually switch to 5 mins for observation. Keep in mind though that I don't trade intra-day much. My hourly habits are better and this intra-day business though lucrative has forced me to think about a trading platform and other things that a person with hourly bar interval isn't much concerned about.
 
Might be a little soon to think about trend changes, possibly, we are looking at a 700 point range with the September low to November high being the extremes. Price is unlikely to keep going at the pace it has without stopping for a breather now and again and for now price has pulled back in the area of the MP, (if traders want to trade this is the place for the heavyweights to do it) but, it is still below this point which would suggest continued weakness.

However, anyone following along on the hourly might be long already or considering going long depending on their entry criteria.

For myself, the May and June low followed by the end of August high was more of a concern, I think the short after the open was triggered around this level and the closing high failed here as well. (I'm visiting family so the charts I have access to are limited and my ipaper weight can only do so much)

I eyeballed it, fib the Dec high, line up the 50% on the Dec low and that might be the only reason we stopped where we did that I can think of, if price gets that far the Nov,Dec lows could be a problem on the way up. Despite this LOLR is down for now, at least on the daily.

edit: I'm hypothesising in the above paragraph.

Track the balance between supply and demand and act accordingly.

I'm rambling now :sleep:
 

Attachments

  • image.png
    image.png
    1.2 MB · Views: 201
Last edited:
Price failed to make much inroads into the drop from last week before breaking lower today, over night price ranged above the PDH. Depending on how tight one was tracking PA with a DL there was a possible entry to the short side in the opening 30 minutes that would have coincided with the overnight range/pre-market hinge being busted to the downside.

Anyone working off the slacker DL might have had to go down to a lower time frame to find a ret to get short after the break, LTF traders tracking the drop after the range/hinge BO could have been chopped in the area.

Another day like today and we are hitting that September low, beyond that lies the August low.
 

Attachments

  • image.png
    image.png
    1.1 MB · Views: 180
Last edited:
For those not able to trade intraday wouldn't the break today below yesterdays low on the daily be an entry?
 
For those not able to trade intraday wouldn't the break today below yesterdays low on the daily be an entry?

Possibly yes, a trader trading the daily could use the break lower as a breakout but the DP is roughly 75 points 50% PB or 150 points away (swing high) and the question would be if the trader could endure such a move.

Edit: the low I think you are meaning is not the low of the drop, one could use your low as the first ret in the drop on the daily TF, slightly smaller DP from this level and a possible entry as price pushes back towards the low. Being intraday I'm used to single figure DP's so I'm sounding alarmed but I'm assuming daily traders are trading proper size and taking it in their stride.

Alternatively one trading the daily would have been short at the top (daily hinge breakdown) and a PB was something that would have been expected at some point given the drop from highs, depending on how one would manage it a trader could have held (with gritted teeth) throughout the PB.

How this will end is anyone's guess but I'd look at the August/September drops and reversals for clues.
 
Last edited:
I was somewhat confused about DP's. I was thinking just above a higher low or just below a lower high. When actually its above a lower high and below a higher low which reiterates what you stated. I was thinking the DP on the daily today would have been just above where price broke below yesterdays low.
 
Looking at the weekly. Is there a clear TR? Did the price break below the TR if there is one? The TR a contained price movement within a time bound range. One can try to use danger point but on the daily the price has been trending down for quite some days. Are the probabilities lower due to that large previous move? I would say that they are. Using daily then gets a bit risky.

Using smaller bar intervals may be better as one can exit faster. It could continue down but we're talking about the probabilities here. On the weaker side what is important to notice is the lethargic rebound. It was feeble and yes there is weakness in the market and the supply is still more eager than demand. I am just keeping an eye on the SL. For now only shorter term seems viable as daily entry was a long time ago. Perhaps additions could be made if one was already in but personally the risk is too great on the daily basis from my perspective.

Gringo
 

Attachments

  • NQ Daily.png
    NQ Daily.png
    29.7 KB · Views: 134
  • NQ Weekly.png
    NQ Weekly.png
    40 KB · Views: 122
Last edited:
NQ hourly.

A dog that doesn't bark is a trader's best friend.

Gringo
 

Attachments

  • NQ hourly.png
    NQ hourly.png
    32 KB · Views: 191
About supply lines, demand lines, swing points.

Supply lines and demand lines are drawn against swing points (see p. 44). Many people can't get this because they can't wrap their minds around continuity of price and that all charts are tick charts, i.e., the ways in which transactions are "bundled" -- time intervals, range intervals, tick intervals, p&f, etc -- are a fabrication, a product of our imaginations. Price doesn't give a damn about any of it. The individual who cannot get this, the continuity of price and that all charts are tick charts, records of transactions, will never be more than marginally successful with a "trading by price" (i.e., tape reading) approach. Not that he should consider this a personal failing. So-called "price trading" gurus like Brooks, Volman, Beggs et al seem not to get it either. Lots of examples are provided in the book, not to mention the post or two I've made over the years. But one doesn't necessarily develop an appreciation for pointillist art by doing no more than looking at a lot of it. Water, Helen. Water.

The perceptive reader will have noticed that some of the S/D lines in the book are pretty tight, so tight that one has a hard time seeing the swing points. And maybe, on the face of it, he can't see them at all. But, clever fellow that he is, he will, because he understands the continuity of price and that all charts are tick charts, understand that those swing points are there in a smaller interval.

Here, if one really wants to do so, he can slap a supply line up against the daily bars that is about as tight as the peel on a banana. But he understands that each of those bars is a swing and that there are a few to many swings concealed within those bars. If he instead plots an "hourly" chart, or plots an hourly alongside the daily, he can see these swings and waves easily and perhaps act with greater confidence when his line appears to have been broken. What his action entails will depend on what he wants out of his trading: does he stay the course or does he flee at the first sign of difficulty? If the latter, does he know how to get back in if the opportunity presents itself?

The two lines are the same. The "break" is in the same place.
 

Attachments

  • Image43.gif
    Image43.gif
    47.2 KB · Views: 221
I got messed up with the lines when the TR started. All I saw was rejection at top of TR and then breakdown from the bottom of TR. It followed up with a TDTDB and BO above the TR + RET and up.

The quick lower low had me looking at the whole down move and a continuation after some sideways movement leading to a wider SL (my previous post). That SL was more in line with the daily. But, yes, it was too wide to represent the price trends on the hourly and was an attempt to have one unbroken line instead of so many more. Yet, it is the change in stride on the hourly lines that keeps the head stable.

Gringo
 

Attachments

  • NQ hourly.png
    NQ hourly.png
    32.2 KB · Views: 182
Last edited:
All of which falls within the rubric of "trading price", and is perfectly fine.

However, I do encourage those who are studying the book not to overlook one of its chief lessons, emphasized also in the free material I posted to the other thread: weekly, daily, hourly. Keeping this in mind at all times prevents one from getting lost, the reason why I posted that weekly yesterday.

Db
 
Status
Not open for further replies.
Top