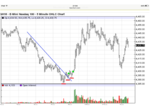
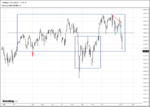
Whatever one does from this point forward for the day, this morning provided an object lesson in analysis, determination of danger points, and assessment of risk. Even if one missed 86, which I posted at 0836, price returned to 91 ten minutes later. What's the danger point? What's the risk? Is the trader willing to accept that risk? If he doesn't know any of this, I hope he's not trading.
Db
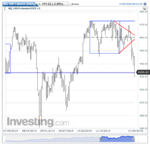
My danger points on a chart annotated with dbs comments from this morning.