You are using an out of date browser. It may not display this or other websites correctly.
You should upgrade or use an alternative browser.
You should upgrade or use an alternative browser.
- Status
- Not open for further replies.
dbphoenix
Guest Author
- Messages
- 6,954
- Likes
- 1,266
4+ hours to the NY open and it looks like price has decided to head south rather than retest either the supply line or 4300. All that may change in 4+ hours, but this is the hand as it is now.
I post very little regarding intraday because no one that I know of trades it, so there's no point in taking the time. And Gringo does a fine job of posting interday charts (Kleft is getting there 😉). However, while observation is important, one can develop an observational mindset that prevents him from ever getting off the dime and becoming a trader rather than settling in to the life of a message board habitue. And I have to assume that those who've bought and at least read if not studied the book are interested in becoming traders. Full-time, self-supporting traders. In order to do so, one must begin to look forward, preferably with a map, not stare fixedly into the rearview mirror. Those who don't develop this forward-looking mindset have wasted and are wasting their time and their money and their lives. Even a brief survey of journals here and elsewhere reveal that a great many people spend years at this, years, getting nowhere. Like psychiatric patients who are forever getting better but never getting well, these shadow traders sit unmoving and immovable in front of the Mirror of Erised, when they could be engaged in activities that are vastly more productive and rewarding.
The following set of charts bring us to the present. As I've been futzing with this for a while, it is now only 3+ hours until the open, but little has changed.
Looking forward, what are you going to do? Whether or not something was a good entry last night or yesterday or last week is irrelevant. What are you going to do now? What are you going to look for? What are you going to do about it if and when you see it? If you don't know, explain what it is you're confused about. My chief objective now and in the near future is improving the book, particularly with regard to clarification. But I can't clarify what I don't know is confusing.
Incidentally, while I understand and am somewhat sympathetic to the "I have a job" mantra, using it amounts to an excuse, not a reason. Kleft works on an oil rig on a three-week rotation and has made more progress than anybody. Why? Study, practice, experimentation, review, meticulous records, more study, more practice, more experimentation. Opportunity knocks on the door, but it doesn't break it down and grab the trader by the throat, dragging him into profitability.
Db
Attachments
Last edited:
Gring0
Well-known member
- Messages
- 264
- Likes
- 128
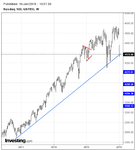
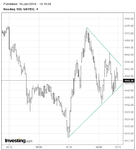
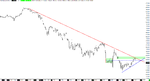
Weekly: Price is close to a long term trend line. Potential for bounce or demand to come in. An old hinge also has median projected around these price levels.
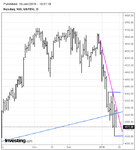
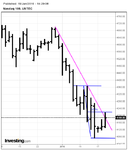
Daily: Price is trending down. Supply line has not been breached.
Hourly: Price is trending down.
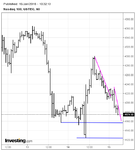
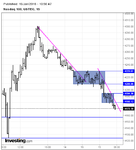
15 min: Price is in a down trend. Areas of interest are show with boxes.
Areas to watch: 4158, 4120
Other levels to watch for shorter term are on 15 min chart.
Actionable behaviour: Price would break hourly supply line, retrace and rise.
Gringo
Daily: Price is trending down. Supply line has not been breached.
Hourly: Price is trending down.
15 min: Price is in a down trend. Areas of interest are show with boxes.
Areas to watch: 4158, 4120
Other levels to watch for shorter term are on 15 min chart.
Actionable behaviour: Price would break hourly supply line, retrace and rise.
Gringo
Attachments
I'm stepping aside from shorting for a while. CAC and FT seem to have slipped off my downtrend and are going sideways, or going to range. I'll see what happens with Nasdaq this afternoon.
I don't often come on---sorry! Interday and the Missus keep me busy but this morning I've knocked off early.
I don't often come on---sorry! Interday and the Missus keep me busy but this morning I've knocked off early.
dbphoenix
Guest Author
- Messages
- 6,954
- Likes
- 1,266
As regards trading daily charts (see my post above), the SLA/AMT becomes about as simple as it gets. The number of decisions one has to make are minimal. When one has to make them depends largely on the trade management and risk management aspects of one's individual trading plan. These cannot be prescribed. Though the SLA/AMT rules apply throughout, the decision regarding how much risk one can and is willing to tolerate must be an individual one. Not everyone is willing to risk a hundred NQ points on any given trade.Before evaluating a given set of circumstances, then, a "market picture", one must first decide, again, just exactly what it is he wants, how he plans to go about getting it, and how much he's willing to risk to get it. Without that, whatever "trading" he engages in is essentially masturbatory.
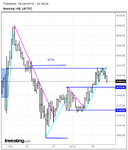
In the set of charts above, posted again below, one can see that price was in a downtrend until Tuesday. All this has been addressed in this week's posts. The daily supply line was then broken. What does this mean? It means that there was a change in stride. Does this change imply reversal? Maybe. Maybe not. It doesn't matter. One can't know in real time whether one has a reversal or a dog. But one can plan in advance what he will do about either.
If one is the nervous sort, he would likely exit at the break of that line. But then what? If he were watching price move in real time, he would note that price rallied up to 4360 and feel smug about having exited his short (if he weren't watching price move in real time, he could use the hourly as a proxy in order to determine what price had been doing while he was absent). But then he would see price run out of gas and make a U-turn, quickly breaking his demand line, at which point he would likely begin calling himself a schmuck again for having been frightened out of a perfectly good short.
If one simply cannot tolerate the sort of movements involved in allowing price to swing on a daily chart, in this case over a hundred points, then he has no choice but to revert to the hourly in order to re-enter and manage his trade. The upside is that the risk of doing so is so much less. The downside is that he is now enmeshed in hourly swings, and these will take more time, more attention, different management, and a continual re-assessment of risk, of what is being risked, of what can be tolerated. If one had entered the short properly, 400+ points higher, the 100pt break in the supply line might not be so intolerable, particularly if he understands the implications of AMT that price will likely reach 4125+/- (which it did, forecast in advance by anyone who can draw a straight line). Yes, these are substantial moves. Mega-moves. But that's what trading daily charts is all about. You're not scalping for ticks so that you have something to chat about on message boards. If one can and did tolerate this break and chose instead to observe price rather than freak over the break (he is after all hundreds of points in profit), then he is just fine. The events since the break are of no importance, other than what turned out to be a retracement was confirmed the following day and his short is still good. All is well in Smugville.
But if he couldn't stand it, if he segued into the realm of the hourly chart, even if he entered properly at or shortly after the break of his demand line, he would soon be faced with the same issues of line break and how much is too much and how much of a break he can and is willing to tolerate. Rules are rules, but no one can make these decisions for him. Rules are rules, but whether or not the trader follows them is out of the SLA/AMT's hands (so to speak). I'm not going to draw in lines highlighting swing highs and lows and ranges and halfway levels that the trader might incorporate to help him make his trade management decisions. The point here is that once one leaves the daily highway and begins following the hourly detours, he can easily find himself dealing with mud and busted fences and washed-out bridges and flocks of sheep blocking the road and flat tires and running out of gas in the middle of what appears to be nowhere.
Trading the daily chart is more than was that a good entry yesterday, much less dwelling on the missed opportunity from last week. Or last month. Trading the daily chart requires a thorough understanding of and acceptance of one's tolerance for risk. One may understand the SLA well. One may be able to draw the lines and spin out scenarios like the best vendor explaining the best hindsight charts in the most expensive trading academies. But unless one has come to terms with risk, it's all masturbatory, and one can look forward to years of wandering the same roads, even after his car has died and he must travel on foot, living on nuts and berries, if he's lucky enough to get them. Dandelions and tree bark if he isn't.
Attachments
dbphoenix
Guest Author
- Messages
- 6,954
- Likes
- 1,266
Tacking into, through, and against the wind.
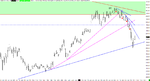
Note that after breaking a DL that could be drawn from yesterday's low to yesterday's high, price retraced at 0100 on the hourly. This was confirmed at 0300. This not only confirms the downtrend as well but also enables you to draw a supply line. The end of this SL is currently at about 4200.
Therefore one has several roadsigns to follow in order to make real-time trading decisions:
Is the retracement still good, i.e., has its swing high -- or DP -- been violated?
Is the SL still good? Has it been touched? Broken? If broken, by how much? How much is too much?
Where is all of this taking place? What is the context with regard to the daily low? The last hourly swing low?
What are all of the things that can happen in re price from this point forward? What do I plan to do about each and every one of them? How much risk is involved in each of these options? Which can I tolerate? On which must I pass?
Db
dbphoenix
Guest Author
- Messages
- 6,954
- Likes
- 1,266
NQ 1min hinge.
Perhaps what I like most about the SLA is that it gets you in when you need to be in and keeps you out when you need to stay out. Regardless of the amount of money made, the amount of money saved due to this feature is remarkable.
Db
dbphoenix
Guest Author
- Messages
- 6,954
- Likes
- 1,266
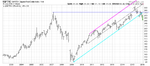
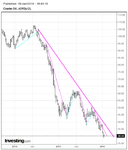
Canadian RE Index. Lines might be foretelling a tale of potential woes.
Gringo
Pay close attention. This is the kind of thing I followed in '07, and I managed to sell my house two months before the housing market peaked, and all this was a couple of months before the spx topped out, a year before the ndx gave it up. I sold for $177K, and the woman who bought it eventually had to unload it for $35K.
Ouch!
Db
Gring0
Well-known member
- Messages
- 264
- Likes
- 128
What's confusing me about the Canadian RE Index is the lag. The markets have dropped quite a bit in two weeks yet that index is just slowly turning towards weakness. The assets people have in housing are staggering in nature though. If it drops it might open the gates of hell for those living on thin margins, potentially having a cascading effect.
Although there are only a few who expect a drop, most are quick to remind that the US housing collapse didn't put a dent in Canadian housing and the banks are resilient her, proclaiming RE to a good investment as it has always gone up. Of course I cannot concretely say if or when a collapse will come. I do believe when housing prices far exceed serviceable income from salaries something is bound to give. The South Sea Bubble, Dutch Tulip Mania, Internet Bubble, US Housing Bubble are all reminders of the results of Irrational Exuberance.
Now looking at the rabbit that you pulled out of your hat by selling before the collapse, it's not hard to see that when the tide turns no boat is left unaffected, and the damage is swift and severe. Whether this is the year or the next isn't important. What's important is to see this tsunami heading straight for the land while the people go about their merry way living pay cheque to pay cheque and carrying huge debts.
Gringo
dbphoenix
Guest Author
- Messages
- 6,954
- Likes
- 1,266
This is a nice illustration of how to locate a trading opportunity. If one is trading the hourly, he's doing so after approaching the hourly from the weekly and daily in order to provide context. Without context, the trades become increasingly random, and developing a consistently-profitable trade plan becomes next to impossible. Additionally, whatever is going on within the hourly is irrelevant as the hourly trader is trading with other hourly traders and with daily traders. This encourages equanimity.
If one is trading intraday, he still must approach the trade as done here in order to provide context, and for the same reasons. If he can ride the coattails of the hourly traders, fine. If he ignores them, he can easily wind up chopped.
Db
If one is trading intraday, he still must approach the trade as done here in order to provide context, and for the same reasons. If he can ride the coattails of the hourly traders, fine. If he ignores them, he can easily wind up chopped.
Db
Gring0
Well-known member
- Messages
- 264
- Likes
- 128
Too bad the SLA wasn't hatched in '99 . . .
You weren't ready at that time for such simplicity. Me and my fellow comrades hadn't yet forced you to pull your hair out with our consistent failures!
Gringo
dbphoenix
Guest Author
- Messages
- 6,954
- Likes
- 1,266
Remember tho in '09, we didn't "call" anything; we just traded it via Wyckoff. As I recall, I started putting the SLA together in '10.
As for failures, if I had had any idea back then that the condition of the schools had deteriorated so badly, I wouldn't have approached the "instruction" (for want of a better word) the same way. The SLA bypasses so much.
Db
As for failures, if I had had any idea back then that the condition of the schools had deteriorated so badly, I wouldn't have approached the "instruction" (for want of a better word) the same way. The SLA bypasses so much.
Db
Left the DP's off as they would really clutter the charts.
Interesting, Kleft, how you overlay the hourly on top of the five minute to create context. A question...
I see how a bounce off the hourly hinge SL and the 2nd failure (at 0650) to breach the last swing high (made at 0315) on the five minute would help make a case for taking these shorts. But what does price being within the second narrower range (green area on the 5 min chart) mean for taking the first short? Does DT stand for Danger something? Territory? If so, wouldn’t you have waited for price to exit out of it before entering? Or maybe you thought price was headed in the right direction as a result of the failures, and therefore felt confident enough to get in “early,” i.e., before leaving the green zone and before a break of the tightest trend line. (I'm guessing you would have drawn the median line through the range if the entry had to do with bouncing off it.)
- Status
- Not open for further replies.