You are using an out of date browser. It may not display this or other websites correctly.
You should upgrade or use an alternative browser.
You should upgrade or use an alternative browser.
- Status
- Not open for further replies.
Gring0
Well-known member
- Messages
- 264
- Likes
- 128
If there is confusion regarding where to enter the above trade, a sell stop placed at the red dot will be triggered the following day (this is assuming that one isn't watching the chart; if one is watching the chart, then he's in a position to trade a smaller interval). If for some reason the trader doesn't want to use a sell stop, he can enter at the first retracement on the hourly or anywhere in the next retracement.
The cue is taken off the daily. The entry may be taken off the daily or the hourly. Trader's choice, depending on how much time he has to devote to this and if he is available when the time comes to make a decision.
Db, Is the DP at the top of the 2/04 bar at 4206.50?
dbphoenix
Guest Author
- Messages
- 6,954
- Likes
- 1,266
Db, Is the DP at the top of the 2/04 bar at 4206.50?
Depends on how and where and when you entered. If you placed a sell stop below the daily low and found that the market stopped you in the next morning, then your DP would be above the "last swing high", and what that would be would depend on whether you're using a daily chart or an hourly. If you entered on the hourly, it makes sense to use the hourly for your DP.
Your objective, of course, is to give the SLA a chance to cover your ass. At this point, price is bumping up against the hourly supply line, and if you exit on a break of that, you have a decent profit. If it doesn't break, then just hang on for the ride.
Db
dbphoenix
Guest Author
- Messages
- 6,954
- Likes
- 1,266
With regard to posts 558 and 559, this trade, and the rules* regarding retracements and retracement entries, continues to block some traders from making successful entries.
While trading retracements on tick charts is challenging to say the least, and the reason why I suggest not attempting to apply the SLA to tick charts, trading a daily interval is relatively simple. Even though price does not actually "close" until Friday afternoon, trading is for all intents and purposes suspended at the NY session close. This gives one the opportunity to determine whether he's got a retracement or not.
There are also difficulties presented by a failure to engage the market. If one is perpetually looking back at what should have been done, no progress will ever be made unless and until the trader converts what should have been done into what will be done the next time. If one finds himself repeatedly thinking "I should have entered there", he must go on with it and determine just what it was about "there" that made it such a good entry. What exactly were its characteristics? This of course is the chief objective of observation, but the observation "phase" is not one to go through and be finished with; it goes on every day, and the notes one takes as a result of the day's chart review become an ongoing log of observations, all of which will inform future trading decisions. I've been doing this for almost twenty years, and I still take daily notes. The SLA will never be anything more than an intellectual exercise unless and until one snaps to and begins using it in real time.
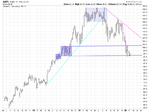
In this particular case, the demand line is broken. Given that one is using a daily interval, there's no doubt about that. Even if price were to rally after the end of the session, the line is still broken. One therefore waits for a retracement (rule 2). If one does not resort to a smaller interval, such as the hourly, he waits until that retracement appears on the daily chart. This occurs the next day as illustrated by the higher low.
So now what? What went on inside the bar, during the day, is not particularly relevant in terms of the entry given that one could not know until the bar was complete whether it would end up being a retracement or not. But, again, by the end of the session, one knows that he does in fact have a retracement. Beginning at that point, he has at least three choices:
(1) determine the danger point and enter however many points he's willing to risk below that point. This entry will have to be somewhere below the "close", or what is at the time the current price, since any entry above that level will not be triggered unless price rises and catches it.
(2) enter below the "close" via a sell stop or enter outright at what is then the current price (the latter not recommended as price might rally against you).
(3) enter below the day's low via a sell stop. One advantage of this is that the trade can be placed before one goes to bed, and when he wakes up the next day, he's either in or price has moved against him and his trade is never triggered. Yes, it is possible for the trade to be triggered and for price to reverse and head in the opposite direction (the "dog"), but it is in the nature of the stride break -- which takes us back to Wyckoff -- and the reasons for it in terms of the imbalance between demand and supply that the probability of failure in this circumstance is much less than the probability of success. In this example, there is no possibility of entering above the horizontal line on the hourly (the low on the daily) as one doesn't know until the session is ended whether he has a retracement or not. Therefore, he places his sell stop somewhere around 4110 and goes to bed. If he doesn't do that, preferring instead to wait for a retracement on the hourly, then he has to wait for the next opportunity, illustrated by the red dot on the hourly chart at about 4025. Given that this is 80+ points below the entry off the daily bar, the disadvantages of this should be clear. But even though one cannot initiate a hindsight trade, he can see when he places his sell stop below the low of the daily bar what the "wave" within that bar consisted of: a hinge and a break out of that hinge. This will have nothing to do with the proper placement of his sell stop, but at least he will know that he is placing it below evidence of weakness, and that the probability of continued weakness that will trigger his trade is greater than a trigger followed by a rally given the dynamics of hinges. Price may rally and he may have to exit the trade at a loss, but that's the nature of trading, not to eliminate losses but to determine whether or not over a series of trades the probability of success is greater than the probability of failure.
As for the assumption of risk, one need not be mechanical about it and wait for price to move all the way back to the top of the hinge before exiting and taking his loss. If he has done the observation work, he will know what to expect a successful trade to do. He will know the odds of price returning to 4120 and then continuing the fall, of re-entering the hinge and then continuing the fall, of rallying through the hinge and then continuing the fall, of rallying all the way back to the top of the hinge and beyond and then continuing the fall. If he has not done the observations, then he'll have no idea what to expect, which is where fear gestates.
Db
*2. When price breaks a line, exit. If it was trending and takes off in the opposite direction (a reversal), wait for a pullback (a retracement).
3. Enter on that retracement and stay in until your line is broken.
3. Enter on that retracement and stay in until your line is broken.
While trading retracements on tick charts is challenging to say the least, and the reason why I suggest not attempting to apply the SLA to tick charts, trading a daily interval is relatively simple. Even though price does not actually "close" until Friday afternoon, trading is for all intents and purposes suspended at the NY session close. This gives one the opportunity to determine whether he's got a retracement or not.
There are also difficulties presented by a failure to engage the market. If one is perpetually looking back at what should have been done, no progress will ever be made unless and until the trader converts what should have been done into what will be done the next time. If one finds himself repeatedly thinking "I should have entered there", he must go on with it and determine just what it was about "there" that made it such a good entry. What exactly were its characteristics? This of course is the chief objective of observation, but the observation "phase" is not one to go through and be finished with; it goes on every day, and the notes one takes as a result of the day's chart review become an ongoing log of observations, all of which will inform future trading decisions. I've been doing this for almost twenty years, and I still take daily notes. The SLA will never be anything more than an intellectual exercise unless and until one snaps to and begins using it in real time.
In this particular case, the demand line is broken. Given that one is using a daily interval, there's no doubt about that. Even if price were to rally after the end of the session, the line is still broken. One therefore waits for a retracement (rule 2). If one does not resort to a smaller interval, such as the hourly, he waits until that retracement appears on the daily chart. This occurs the next day as illustrated by the higher low.
So now what? What went on inside the bar, during the day, is not particularly relevant in terms of the entry given that one could not know until the bar was complete whether it would end up being a retracement or not. But, again, by the end of the session, one knows that he does in fact have a retracement. Beginning at that point, he has at least three choices:
(1) determine the danger point and enter however many points he's willing to risk below that point. This entry will have to be somewhere below the "close", or what is at the time the current price, since any entry above that level will not be triggered unless price rises and catches it.
(2) enter below the "close" via a sell stop or enter outright at what is then the current price (the latter not recommended as price might rally against you).
(3) enter below the day's low via a sell stop. One advantage of this is that the trade can be placed before one goes to bed, and when he wakes up the next day, he's either in or price has moved against him and his trade is never triggered. Yes, it is possible for the trade to be triggered and for price to reverse and head in the opposite direction (the "dog"), but it is in the nature of the stride break -- which takes us back to Wyckoff -- and the reasons for it in terms of the imbalance between demand and supply that the probability of failure in this circumstance is much less than the probability of success. In this example, there is no possibility of entering above the horizontal line on the hourly (the low on the daily) as one doesn't know until the session is ended whether he has a retracement or not. Therefore, he places his sell stop somewhere around 4110 and goes to bed. If he doesn't do that, preferring instead to wait for a retracement on the hourly, then he has to wait for the next opportunity, illustrated by the red dot on the hourly chart at about 4025. Given that this is 80+ points below the entry off the daily bar, the disadvantages of this should be clear. But even though one cannot initiate a hindsight trade, he can see when he places his sell stop below the low of the daily bar what the "wave" within that bar consisted of: a hinge and a break out of that hinge. This will have nothing to do with the proper placement of his sell stop, but at least he will know that he is placing it below evidence of weakness, and that the probability of continued weakness that will trigger his trade is greater than a trigger followed by a rally given the dynamics of hinges. Price may rally and he may have to exit the trade at a loss, but that's the nature of trading, not to eliminate losses but to determine whether or not over a series of trades the probability of success is greater than the probability of failure.
As for the assumption of risk, one need not be mechanical about it and wait for price to move all the way back to the top of the hinge before exiting and taking his loss. If he has done the observation work, he will know what to expect a successful trade to do. He will know the odds of price returning to 4120 and then continuing the fall, of re-entering the hinge and then continuing the fall, of rallying through the hinge and then continuing the fall, of rallying all the way back to the top of the hinge and beyond and then continuing the fall. If he has not done the observations, then he'll have no idea what to expect, which is where fear gestates.
Db
Attachments
dbphoenix
Guest Author
- Messages
- 6,954
- Likes
- 1,266
As regards post 566, even though none of you are trading intraday, it's informative to look at a 1m chart when convenient so that one can see how price behaves when dropping below the previous day's "low". The fact that it spent 20m trying to get past that level and couldn't tells you that the line you drew was in fact important and not just your imagination.
Attachments
dbphoenix
Guest Author
- Messages
- 6,954
- Likes
- 1,266
Some large trips today. There's a kind of trading range at this weekly low but price is refusing to go down. Every time looks it's going demand shows up. At least we were aware that this area might get some importance.
Gringo
On the upside, I'm looking at the supply line. On the downside, I'm looking at 3750, depending on how long it takes price to fall.
Db
Gring0
Well-known member
- Messages
- 264
- Likes
- 128
I keep telling myself that these lines are in my head, not in the market, but good grief. I had the SL at 4038.
4038 was pretty important. Round trip to it failed before getting too close. This could turn the market on its head in a few days and get the forever long crowd and the funds trembling. The important thing was the clarity of view by looking at the daily and seeing those rejections on smaller intervals.
Gringo
Last edited:
dbphoenix
Guest Author
- Messages
- 6,954
- Likes
- 1,266
4038 was pretty important. Round trip to it failed before getting too close. This could turn the market on its head in a few days and get the forever long crowd only daily and the funds trembling. The important thing was the clarity of view by looking at the daily and seeing those rejections on smaller intervals.
Gringo
There is also volume. Volume is addressed in Notes but in nothing else I've posted publicly with regard to the SLA/AMT (volume is its own subject). I've gone into it in the Wyckoff thread, but I don't want to introduce the SLA into that thread (though it should be obvious to anyone who reads it where the SLA came from).
Having said that, there's nothing even remotely climactic about this volume. If W's views are still relevant, and I have no reason to believe that they aren't, we have further downside unless volume kicks in soon.
Currently, the weekly trendline is around 3750, though it will be higher over the coming days as it is diagonal. A 20% drop would put us at about that level (as of now, 3800), and The Money likes those kinds of figures. One can keep them in mind without having to refer to charts.
Db
dbphoenix
Guest Author
- Messages
- 6,954
- Likes
- 1,266
Incidentally, unless I missed it, there's been no mention of the fact that yesterday was a retracement. An entry off this would be below yesterday's low, 3897.5. The DP would be above today's high, 4041. That's a lot of risk to assume. However, whether the trade works or not will depend entirely on how price behaves (there's tons in the Wyckoff thread on this). One can just sit like a knot on a log and watch price rally all the way back to today's high, or he can be a trader.
So let's see what traders do today and tomorrow. And reading what I've posted to the Wyckoff thread would not be a bad idea.
Db
So let's see what traders do today and tomorrow. And reading what I've posted to the Wyckoff thread would not be a bad idea.
Db
dbphoenix
Guest Author
- Messages
- 6,954
- Likes
- 1,266
In reference to an arc in the other SLA thread, this is the RET on the 5s. If one is squeamish about taking it, the first question, as always, is what's the risk?
Play it, not like an outsider, but an insider. Try to get the big fellow’s point of view. Reason out what you would do if you were in his place. If you were trying to buy, you would force the price down as low as you could. When it came time for you to sell, you would spread bullish tips and print optimistic news items through your press agent in order to induce other people to buy; thus you would create a good market on which to sell. That is the game as the large operator plays it, and when you understand how he works and you trace his movements on your charts, you are making him work for you and profiting by his efforts.Thus you continually increase your chances to win. (Richard Wyckoff)
Play it, not like an outsider, but an insider. Try to get the big fellow’s point of view. Reason out what you would do if you were in his place. If you were trying to buy, you would force the price down as low as you could. When it came time for you to sell, you would spread bullish tips and print optimistic news items through your press agent in order to induce other people to buy; thus you would create a good market on which to sell. That is the game as the large operator plays it, and when you understand how he works and you trace his movements on your charts, you are making him work for you and profiting by his efforts.Thus you continually increase your chances to win. (Richard Wyckoff)
Attachments
Last edited:
dbphoenix
Guest Author
- Messages
- 6,954
- Likes
- 1,266
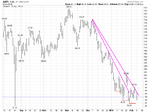
And now the trader -- even the trader who is only simtrading -- is faced with the same decision as on Jan 12: do I exit at the break of the SL or do I look at additional factors? In January, the decision rested on how much of a break would more likely result in a reversal than a continuation (the beginner, again, would just exit). Now there is the matter of the longer-term SL to consider.
There is no right answer, but it's something that must be decided ahead of time as part of one's strategy.
Db
There is no right answer, but it's something that must be decided ahead of time as part of one's strategy.
Db
Attachments
Gring0
Well-known member
- Messages
- 264
- Likes
- 128
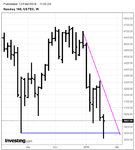
NQ Weekly: 3900 area for S held. Double bottom. Test.
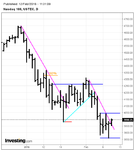
NQ Daily: Dog. SL breach. Important level on weekly. Potential TR forming with tight closes at median (similar to behaviour in mid Jan).
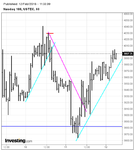
NQ Hourly: SL breach. RET. Rise. DL intact.
Gringo
NQ Daily: Dog. SL breach. Important level on weekly. Potential TR forming with tight closes at median (similar to behaviour in mid Jan).
NQ Hourly: SL breach. RET. Rise. DL intact.
Gringo
Attachments
dbphoenix
Guest Author
- Messages
- 6,954
- Likes
- 1,266
NQ Daily: Dog.
Actually, it's not, given that the retracement for the short was confirmed. As price did not continue to fall, this may be used as a criterion for an exit, particularly if one didn't enter until that second RET, but one may want further information before taking the opposite side.
Db
- Status
- Not open for further replies.