Skim, what do you think of this?

Sorry Neil

I have been trying to paste these items directly onto the reply but having problems doing this. I am not Vgood when it comes to all the IT stuff.
 
neil, do a search on kazza for an excel viewer. Yuo don't need the whole Excel program, just the viewer
 
SL, can you not just "print screen" and then paste your charts into something like MS Paint, save them as a .GIF and then upload them? Sorry if this has already been covered.
 
Well, I have just found about thirty saved charts on my C drive. Thats why my pc was slowing up.

I should be able to post like every one else toady.

Cheers guys.
 
The latest selection from the sweet trolley

Again, these are just academic.
 

Attachments

  • dow 5min19.png
    dow 5min19.png
    28.5 KB · Views: 373
The break out

Five minute chart.

Well, this harder then I expected. Price and volume and nothing else is going to take time. In need of a lot of reading.
 

Attachments

  • dow 5min20.png
    dow 5min20.png
    29.4 KB · Views: 383
Stoploss, I'm a bit like yourself. Trying to switch currently from trading YM on a 1min to YM and ES on 5m/10m charts.

Keep up the postings, though. Good stuff.

All the best

RR
 
Cheers Rossored.

Not sure if I am barking up the wrong tree or just barking.

I am going to stick with this. It seems to make more sense then using all those indicators.

Cheers mate.
 
Hiya Skim

You must have had a good day.

A few questions for you. Well a lot of questions for you.

I got A.

On C I am long on the breach of that small peak in between the two close together HLs. You went HH, HL and long trigger.

In between A and B would you have not been tempted to go long
on the HL or did you view the area of the gap as resistance and therefore there was not much room for an upward push.

On the double top, was there any temptation to short against the gap.

I understand B but I did not see it. I need to peel my nose off the screen as I and probably looking too hard.

Thanks for this Skim.
 
I need a coffee

Again, all academic entries as this is all new to me.

Here we go. I found this bit the hardest part of the day.
 

Attachments

  • dow 5min23.png
    dow 5min23.png
    27.4 KB · Views: 351
You're still trying to run. Learn to walk first. I've only ever mentioned bars - no gaps, no volume, no fibs, no Gann, nowt else. Don't worry about what you do inbetween - make sure you get the basics first, understand why, understand where your stop is and where you are moving it to, and get used to the flow of the market.

Today was just one grotty day to start with - over four hours she had a total spread of 5 points. That tells you something - a move is ahead ONCE a bottom is in place. So you just sit and wait for it.

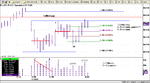
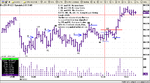
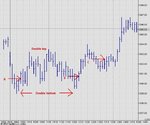
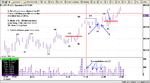
Look at the bigger picture, 30 min chart - inverted h&s over the last two trading days. On the 10 min there is a double bottom. Therefore, once those were in place, she was off. She always does that, so you just have to watch for the signs.

There's loads more for you both to get used to just using what I've shown you so far - hope you noticed that theoretically you should have been short out of the starting gates at 9:30. :D

Today was not an easy day - it would have been clearer for you on a day with a wider spread.
 
Hiya

Ok, no more running.

Got it I think. Double top which is also a right shoulder of a H&S on the ES continuos contract right.

I think I am looking for triggers all over the place. How many entries on average should made on the five minute ES.

Should I be looking for one in the morning session. Walk away during their lunch and then one more in their afternoon session. If I do that, then maybe I will not get excited by every double top I see.

Cheers
Andy
 
Top