S&P 500 & other indexes - intraday. Plus chat

Well - long term, the VAL is 1322.25 and so I can't see why we can't get above that but right now, I think we have a fighting chance of a move down which is getting slimmer by the minute!

I don't disagree with that. I do however think that it hasn't got legs today.

Hit 14, rotate back down to 9, rotate back up to 14 for a re-test and possibly hit NVPOC at 14.75 and sell-off again.

It just doesn't feel like a double distribution type day.
 
I don't disagree with that. I do however think that it hasn't got legs today.

Hit 14, rotate back down to 9, rotate back up to 14 for a re-test and possibly hit NVPOC at 14.75 and sell-off again.

It just doesn't feel like a double distribution type day.

Yup - that's why I shorted 12.75 after it appeared that we might be rolling.

Plus I was on Skype with C_V today and he was busting my balls about scalping little nuggets out of big moves... :LOL:

My next target 1309 is just below an intraday LVN @ 1309.25 - so I might be Toast anyway.
 
Yup - that's why I shorted 12.75 after it appeared that we might be rolling.

Plus I was on Skype with C_V today and he was busting my balls about scalping little nuggets out of big moves... :LOL:

My next target 1309 is just below an intraday LVN @ 1309.25 - so I might be Toast anyway.

You've just reminded me. I need to talk to CV. I was supposed to talk to him yesterday and got completely caught up in some domestic nonsense.
 
OK C_V - is that good enough for you?

In @ 1312.75
T1 - 1311.75
T2 - 1309
T3 - 1303.75

Stop now @ 1312. Left a "Close @ Time" command on to close this if it's still open 5 mins before the close. I hope they fixed the bug where it closes out every position on your account.

Interesting how that bounced off the intraday LVN there (red arrow).

ToBed.png


One day I'll find a single charting package that can show me what I want on one chart...

Tomorrow - back to scalping. None of this nonsense.

I'm off to bed - 11:15 here & up at 7:00 to shower Zoe.

G/L
 
Wish I could understand what on earth DT is doing ?

My simple system of trendlines is obvious.
 

Attachments

  • S&P 500.PNG
    S&P 500.PNG
    123.9 KB · Views: 166
Agree Enzo. I think it is confusing most of the time - but what you can do is say:
"If I see a, I will trade like this"
"but if I see b, I will trade like this"
Just to add to this Enzo, I generally do ok not because of prediction but because of reaction. It's how you deal with the 'now' that makes the difference.
In the last 30mins before RTH open, I start visualising how possible scenarios may play out, all of them with me successfully executing the trade to a profit. If you understand a little about sports psychology you will always understand why it is important to go into this with a belief you can win, even if the reality doesn't always work out like that or the result is not the one you expected.

Yes, I very much agree with both...
One other great and very successful trader told me once "sometimes you plan... sometimes you react"
So sometimes you wait for your planned trade patiently and sometimes you need to react into the final outcome of 2 different/opposed scenarios "previously planned"...
So the key words here are "waiting" and "planning", as you both say ....and do
(y)
 
If you understand a little about sports psychology you will always understand why it is important to go into this with a belief you can win, even if the reality doesn't always work out like that or the result is not the one you expected.

The famous "sport psychologist" visualization of the "perfect" outcome of a match, play, intervention, etc, etc....Sounds me quite familiar
Very useful thing to be sharp and ready for "the show"....for the trading show as well, of course
(y)
 
Just my amateur opinion but I look at the t/f above, like 1 hour to make sure I am not trading against the prevailing trend
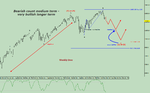
IMHO, that's no amateur at all mate... really great thing to do, as the market inertia is gonna help you more often than not to make your trades work quicker and cleaner in most of the cases (of course, not always)..... I personally don't bother too much into analyzing higher TF's "trend" direction, but higher TF's levels of interest do really hep my intraday trading a lot...... :)
 
Don't over do things Rob !

What are you doing the rest of the week ? Or shouldn't I ask ?

:p

:LOL:

I have another pet project that is just starting so I'll probably do a bit of work on that. I know with weeks like this week, that if I carry on trading, I will over-trade and lose.

That's not to say I won't carry on posting. Just not trading, that's all.
 
Wish I could understand what on earth DT is doing ?

My simple system of trendlines is obvious.

In a nutshell...

The market is an auction. Just like a banana auction, if the last guy paid $500 for 100kg of banana's - you'd certainly not want to pay $750 for the next 100kg for sale in the same auction. You have a concept of value. So it is with the markets.

There's a lot of people trading and obviously there's a lot of disagreement about what value is. People trade for all sorts of reasons and have all sorts of opinions. There are hundreds of thousands of people trading & of course, probably as many opinions about what the value is.

The areas where the most trading takes place is considered an area of value. Lots of people trade there and so this is where the most agreement about the price is. With so many people playing, you can't have one definition of value but you can say "this is where the most people agreed on it".

If you have an area where you can say the majority agreed on price, then you look at extreme areas above and below there. The chances are that way above value, you will have people saying "sh1t, this is expensive". Way below value, you will have people saying "Damn, this is cheap". And that is basically all there is too it.

Your trend channels might just be lines you draw on a chart to you. Someone might have read in a book that you can draw a line and it'll hold without any rhyme or reason.Fact is, what you see when a market is channeling down is the gradual reduction of what people consider 'expensive' & 'cheap'. The market moves to the top of your channel looking for sellers who think these prices are now expensive and therefore a good price to sell. Then it goes the other direction looking for buyers who think the prices are cheap.

This is price discovery.

A lot of people say it's supply and demand driving the markets and in my opnion, that's a sort of half-truth. In the case of the banana auction, you might just pay $750 per 100kg if it's the last lot in the auction. With the index futures markets supply (for contracts) is infinite. With stock markets supply is limited to the float and 'real supply' actually does influence prices as availability becomes scarce.
 
Last edited:
In a nutshell...

The market is an auction. Just like a banana auction, if the last guy paid $500 for 100kg of banana's - you'd certainly not want to pay $750 for the next 100kg for sale in the same auction. You have a concept of value. So it is with the markets.

There's a lot of people trading and obviously there's a lot of disagreement about what value is. People trade for all sorts of reasons and have all sorts of opinions. There are hundreds of thousands of people trading & of course, probably as many opinions about what the value is.

The areas where the most trading takes place is considered an area of value. Lots of people trade there and so this is where the most agreement about the price is. With so many people playing, you can't have one definition of value but you can say "this is where the most people agreed on it".


If you have an area where you can say the majority agreed on price, then you look at extreme areas above and below there. The chances are that way above value, you will have people saying "sh1t, this is expensice". Way below value, you will have people saying "Damn, this is cheap". And that is basically all there is too it.

Your trend channels might just be lines you draw on a chart to you. Someone might have read in a book that you can draw a line and it'll hold without any rhyme or reason.Fact is, what you see when a market is channeling down is the gradual reduction of what people consider 'expensive' & 'cheap'. The market moves to the top of your channel looking for sellers who think these prices are now expensive and therefore a good price to sell. Then it goes the other direction looking for buyers who think the prices are cheap.

This is price discovery.

A lot of people say it's supply and demand driving the markets and in my opnion, that's a sort of half-truth. In the case of the banana auction, you might just pay $750 per 100kg if it's the last lot in the auction. With the index futures markets supply (for contracts) is infinite. With stock markets supply is limited to the float and 'real supply' actually does influence prices as availability becomes scarce.

Thanks
 
12:10am AUD RBA Gov Stevens Speaks
12:50am JPY Core Machinery Orders m/m 5.7% 2.0% -2.8%
1:30am AUD Westpac Consumer Sentiment 0.3% 0.8%
6:30am EUR French CPI m/m -0.1% 0.2% 0.1%
7:00am EUR German Final CPI m/m -0.2% -0.2% -0.2%
8:15am CHF PPI m/m -0.2% -0.1% -0.1%
10:00am EUR Industrial Production m/m -0.9% -0.3%
Tentative EUR German 10-y Bond Auction 1.47|1.5
1:30pm USD Core Retail Sales m/m 0.1% 0.1%
1:30pm USD PPI m/m -0.6% -0.2%
1:30pm USD Retail Sales m/m -0.1% 0.1%
1:30pm USD Core PPI m/m 0.2% 0.2%
3:00pm USD Business Inventories m/m 0.4% 0.3%
3:30pm USD Crude Oil Inventories -1.6M -0.1M
6:00pm USD 10-y Bond Auction 1.86|2.9

10:00pm NZD Official Cash Rate 2.50% 2.50%
10:00pm NZD RBNZ Press Conference
10:00pm NZD RBNZ Rate Statement
10:00pm NZD RBNZ Monetary Policy Statement
11:45pm NZD FPI m/m -0.1%
 
Top