robster970
Guest Author
- Messages
- 4,567
- Likes
- 1,390
Finished for the day - trade posted up in a minute

Finished for the day - trade posted up in a minute
I think I already posted up your trade 👍
I tried to fade you and decided not too........😆
I wanted your trade but was too chicken to pull trigger......
same here. I waited and hesitated and missed it altogether. 👎
Peter
Funny, another 30secs of obvious weakness and I probably would have taken it. It just felt too early out of the traps and because it had opened up, I was wary of somebody coming in and just blowing the shorts out of the water......

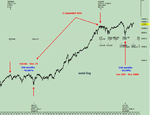
This is a longer term Dow chart. Note the similar patterns as annotated.
Two expanded Flat corrections (in Elliott Wave terms). Very similar in terms of price and time. If the patterns continue as anticipated then the next major move will be up. There is room for lower prices over the coming months but this should be the early stages of a longer term Bull market.

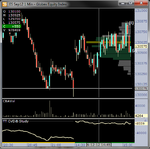
Looking at the last 3 days is interesting if you drill down a bit. Especially yesterday.
Even though we had something a candlestick chartist would probably be able to write a 10,000 word essay on.
As it is, the past 3 days all have something in common, the most volume was traded at the 1315-1317 area. No Pre-market analysis yet but expectation if we get to 1315 today is that we will churn there for a while.

Probably also worth note that pre-market volume is about 75k below average and we've been in a range from 1301-1309, so that's also worth looking out for.