You are using an out of date browser. It may not display this or other websites correctly.
You should upgrade or use an alternative browser.
You should upgrade or use an alternative browser.
S&P 500 & other indexes - intraday. Plus chat
- Thread starter robster970
- Start date
- Watchers 52
Am short from last night little bit down.
High probability of pivot being hit today imo,but my stop may get hit first!
Short 1317.9
stop 1321.6
limit 1312.5
Out of intrest who do you guys use for trading the es?
I moved to IG from city as got sick of platform issues,love ig charts and deal thru but there spread is not great at times its a full point out of hours moving down to .7 and .5 where as city offer .4 all the time on the daily.
Tia
robster970
Guest Author
- Messages
- 4,567
- Likes
- 1,390
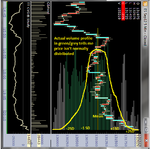
Pat, you know your bollinger bands on your chart? They are 2 Standard Deviations away from the average price (i can't remember how many). That's basically another way of identifying extremes of price. Difference is that DT and I don't use price alone, we use volume traded at price too to make sure people aren't trading at the extremes.
Attachments
Last edited:
robster970
Guest Author
- Messages
- 4,567
- Likes
- 1,390
Sorry if the above post sounded patronising Pat, it wasn't meant to be. It was supposed to be explanatory.
robster970
Guest Author
- Messages
- 4,567
- Likes
- 1,390
Out of intrest who do you guys use for trading the es?
DT and I are direct access via a brokerage. I'm with Velocity and I think DT uses IB but wouldn't bet my house on it.
barjon
Legendary member
- Messages
- 10,752
- Likes
- 1,863
.................A lot of people say it's supply and demand driving the markets and in my opnion, that's a sort of half-truth...........
Nice one, toastie.
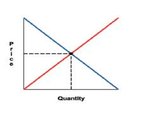
May be a sort of half truth, but what you have described is the basic supply and demand graph. If you think of "quantity" as 100 traders (0 to 100 on the bottom axis) in the thumbnail and the red line representing sellers and the blue line buyers, then at the mid point of price (your value area) 50 want to buy and 50 want to sell. Draw the line from elsewhere on the price axis and that'll give you the number of buyers and sellers (%age) at that price.
Just a shame that the market is not usually so mathematically pure 🙂
jon
Attachments
DionysusToast
Legendary member
- Messages
- 5,965
- Likes
- 1,501
DT and I are direct access via a brokerage. I'm with Velocity and I think DT uses IB but wouldn't bet my house on it.
yup - IB for me...
Mike Kshemaraja
Established member
- Messages
- 852
- Likes
- 63
Here is my take on the 1 hour FWIW
Why? If you have time to explain.
Last edited:
DionysusToast
Legendary member
- Messages
- 5,965
- Likes
- 1,501
Nice one, toastie.
May be a sort of half truth, but what you have described is the basic supply and demand graph. If you think of "quantity" as 100 traders (0 to 100 on the bottom axis) in the thumbnail and the red line representing sellers and the blue line buyers, then at the mid point of price (your value area) 50 want to buy and 50 want to sell. Draw the line from elsewhere on the price axis and that'll give you the number of buyers and sellers (%age) at that price.
Just a shame that the market is not usually so mathematically pure 🙂
jon
sigh.... 🙄
barjon
Legendary member
- Messages
- 10,752
- Likes
- 1,863
sigh.... 🙄
Sigh? Oh, I'm all wrong then?
DionysusToast
Legendary member
- Messages
- 5,965
- Likes
- 1,501
Sigh? Oh, I'm all wrong then?
Well - since you ask... 😆
You started off by saying that what I am really describing is something I actually disagree with.
Futures markets are a mechanism for mathing buyers and sellers of contracts. No trade takes place without a buyer and a seller. The item being traded is a contract and the contracts get created as required. The supply of the item being traded is infinite.
Now - if you put bananas in there, then I would say your graph has merit. In the Financial markets, I think that the model has little merit and is ABSOLUTELY NOT what I was discussing in any way, shape or form.
Of course, perhaps you could go into more detail about what I really meant... 😛
robster970
Guest Author
- Messages
- 4,567
- Likes
- 1,390
Well - since you ask... 😆
You started off by saying that what I am really describing is something I actually disagree with.
Futures markets are a mechanism for mathing buyers and sellers of contracts. No trade takes place without a buyer and a seller. The item being traded is a contract and the contracts get created as required. The supply of the item being traded is infinite.
Now - if you put bananas in there, then I would say your graph has merit. In the Financial markets, I think that the model has little merit and is ABSOLUTELY NOT what I was discussing in any way, shape or form.
Of course, perhaps you could go into more detail about what I really meant... 😛

barjon
Legendary member
- Messages
- 10,752
- Likes
- 1,863
..............Of course, perhaps you could go into more detail about what I really meant... 😛...............
🙂 ok then. I wasn't trying to tell you what you really meant, just saying that what you described about the way people felt at the "extremes" and the "value area" was just like a standard supply and demand graph if you swapped "quantity" for "traders".
At the upper price extreme the s/d model would then show 0 want to buy and 100 want to sell (your "sh1t, this is expensive") with the consequence that the weight of that selling desire would move prices down to search out buyers. Similar with the converse (your "Damn, this is cheap).
So, I wasn't saying that what you were describing WAS supply and demand as in bananas, but something that LOOKED just like the basic SD model if you modelled it graphically.
Pat494
Legendary member
- Messages
- 14,614
- Likes
- 1,588
Why? If you have time to explain.
I like to keep it simple. Having tried and paid out for neural nets etc without much success the simple trend lines of support/resistance seem to be as good as anything and for free !
DionysusToast
Legendary member
- Messages
- 5,965
- Likes
- 1,501

Pat494
Legendary member
- Messages
- 14,614
- Likes
- 1,588
DT and I are direct access via a brokerage. I'm with Velocity and I think DT uses IB but wouldn't bet my house on it.
Much cheaper going with spread bet firms imho
£1 per point with Fins
Mike Kshemaraja
Established member
- Messages
- 852
- Likes
- 63
I like to keep it simple. Having tried and paid out for neural nets etc without much success the simple trend lines of support/resistance seem to be as good as anything and for free !
Thanks Pat.
kimo'sabby
Experienced member
- Messages
- 1,622
- Likes
- 287
OK C_V - is that good enough for you?
In @ 1312.75
T1 - 1311.75
T2 - 1309
T3 - 1303.75
Stop now @ 1312. Left a "Close @ Time" command on to close this if it's still open 5 mins before the close. I hope they fixed the bug where it closes out every position on your account.
Interesting how that bounced off the intraday LVN there (red arrow).

One day I'll find a single charting package that can show me what I want on one chart...
Tomorrow - back to scalping. None of this nonsense.
I'm off to bed - 11:15 here & up at 7:00 to shower Zoe.
G/L
1312.75 lol. I used that one too yesterday. It's a small market.
DionysusToast
Legendary member
- Messages
- 5,965
- Likes
- 1,501
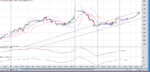
Asia Mixed
Europe Down
Pre market volume about 47k below average just after the news
Pre market stuck in the high volume range we marker out on 7th, 8th, 11th

Considering two options now:
1 – We are still in the same value area we have been trading around since 16th May (big red square)
2 – We are in a new value area that started 4 bars back on the 7th June. (smaller red square)

The top of the 2 areas is about the same anyway – 1322.25. As such, a poke above would be a good
Shorting opportunity – 1326.75, 1331.75 & 1338
The 1320.50 area is a huge LVN, this price has been one of the most rejected prices in recent history.
A fast move up to 1320 off the open and a reversal would be a nice move to take short.
On the long side, 1300 is within the larger value range but not in the one we’ve been in the past 4/5 days.
Below that the 1292 and 1280.50 areas look good places to go long.
IF THE TAPE CONFIRMS THE MOVE!!!
Summary :
Shorts off the open 1320.50
Shorts if we make a decent, sustained swing up – 1326.75, 1331.75, 13388
Longs 1300, 1292, 1280.50
Europe Down
Pre market volume about 47k below average just after the news
Pre market stuck in the high volume range we marker out on 7th, 8th, 11th
Considering two options now:
1 – We are still in the same value area we have been trading around since 16th May (big red square)
2 – We are in a new value area that started 4 bars back on the 7th June. (smaller red square)
The top of the 2 areas is about the same anyway – 1322.25. As such, a poke above would be a good
Shorting opportunity – 1326.75, 1331.75 & 1338
The 1320.50 area is a huge LVN, this price has been one of the most rejected prices in recent history.
A fast move up to 1320 off the open and a reversal would be a nice move to take short.
On the long side, 1300 is within the larger value range but not in the one we’ve been in the past 4/5 days.
Below that the 1292 and 1280.50 areas look good places to go long.
IF THE TAPE CONFIRMS THE MOVE!!!
Summary :
Shorts off the open 1320.50
Shorts if we make a decent, sustained swing up – 1326.75, 1331.75, 13388
Longs 1300, 1292, 1280.50