S&P 500 - Inter Market Analysis

Targets hit on shorts

Analysis worked like clockwork (y):smart:


Good call. Good analysis too. (y)

Would you be interested in joining our SPX 500 competition amongst bloggers here.
http://www.trade2win.com/boards/indices/221156-s-p-500-cash-weekly-competition-2017-prizes.html

Basically, it is a quarterly competition where we forecast (before US market opens on Monday) what the closing index will be at end of week on Friday.

It is a bit of fun between regular members & bloggers.


(y)

Thanks for the invite (y)

I will certainly attempt to, but forecasting further than 24-48 hours is very hard based on inter-market analysis...the success/accuracy rate drops sharply the further out we go as its impossible to accurately forecast 20-40 variables to move in the intended direction.

:smart:


Yep for sure, it is difficult but it's more light hearted bit of competition. It does help sharpen ones approach.

I usually do homework over weekend on as you rightly suggest number of different markets and continents and look ahead to see what announcement and stats to be released.

Look forward to your participation next week onwards then :)
 
S&P 500: trading plan for Tues 4/03/2017

The daily candle put in a pivot low/bottoming tail at 2344 after terrorism concerns via St Petersburgh, Russia triggered a bout of risk aversion.

Daily chart has held Fib 75% resistance on concerns the trump trade has failed and is built on hot air given his health care bill failed to get enough votes.

Weaker economic data in the US + UK failed to support the bullish thesis from EU with stronger PMI and employment numbers.

A drop in US auto sales also hurt sentiment.

60 mins chart is in no mans land , asian markets will now dictate

Resistance seen at : 2370 , support seen at 2325 , 2340.

10 mins - support seen at 2350-2344.


game plan tomorrow: Long at support zones above provided fundamentals confirm, short at resistance zones above given bearish FA

happy to short at 2362-64 zone...targeting 2354-2344 .
 

Attachments

  • S&P500 Index 10m.png
    S&P500 Index 10m.png
    35.6 KB · Views: 320
  • S&P500 Index 60m.png
    S&P500 Index 60m.png
    33.9 KB · Views: 287
  • S&P500 Index Daily.png
    S&P500 Index Daily.png
    35.7 KB · Views: 333
  • S&P500 Index weekly.png
    S&P500 Index weekly.png
    25.1 KB · Views: 304
S&P 500: Trading plan for Mon 10/04/2017

SO FAR
1. TAPER TALK VIA FOMC MINS
2.RATE HIKE TALK VIA FED
3. war - geo pol risk
4. weaker US jobs data

has failed to send equities lower ? What will ? BTFD


I had expected a flush on S&P 500 ....bear flag on daily on friday to 2320 region.
It made sense technically . 1. we held Fib 75% 2. we held diagonal trendline for lower high 3. lower low expected as bearish trend 4. bearish engulfing candle in control

Game plan for Monday is to maintain a short bias until we take out Fib 75% resistance . I will look for the VIX to break out north....
 

Attachments

  • S&P500 Index weekly.png
    S&P500 Index weekly.png
    24.7 KB · Views: 309
  • S&P500 Index Daily.png
    S&P500 Index Daily.png
    38.7 KB · Views: 343
  • S&P500 Index 60m.png
    S&P500 Index 60m.png
    40.1 KB · Views: 309
  • S&P500 Index 10m.png
    S&P500 Index 10m.png
    32 KB · Views: 316
  • PROSHARES TRUST VIX SHORT-TERM FUTURES.png
    PROSHARES TRUST VIX SHORT-TERM FUTURES.png
    37.3 KB · Views: 315
Russell 2000 what do you see ?

1. H&S formation
2. bear flag

WHEN YOU GET A PATTERN LIKE THAT ,ITS A ONE WAY TRADE DOWN
 

Attachments

  • ISHARES RUSSELL 2000 ETF.png
    ISHARES RUSSELL 2000 ETF.png
    38.1 KB · Views: 318
S&P 500 initially short squeezed higher led by stronger Chinese data and a failed nuclear test over the weekend in North Korea. We have thrust higher to test 2341 resistance but remain firmly in a bearish trend as USA/North Korea rhetoric increases and weaker US data continues to weigh.

Daily chart remains an inside bar , bears in control given GEO POL concerns remain.

60 mins - bearish channel resistance

10 mins - resistance at 2340

game plan: bias continues to remain bearish provided we hold 2341 , otherwise we test 2353 and 2357 gap fill.
 

Attachments

  • S&P500 Index Daily.png
    S&P500 Index Daily.png
    33.3 KB · Views: 324
  • S&P500 Index 60m.png
    S&P500 Index 60m.png
    51.3 KB · Views: 311
  • S&P500 Index 10m.png
    S&P500 Index 10m.png
    39.9 KB · Views: 238
S&P 500: Trading plan for 21/4/17

The combo of bullish comments via Trump and Mnuchin certainly triggered a short squeeze in US equities yesterday as Health care bill and tax reform were back in the spotlight. The question is does it have any substance or is it just all talk again ?

S&P 500 closed the gap above at 2358 and held diagonal trendline resistance at 2360 region. The uncertainty regarding the French election over the w/e will keep the index below 2360. We have an unfilled gap below at 2338 and 2328 so keep that in mind for the remainder of the day.
 

Attachments

  • S&P500 Index 10m.png
    S&P500 Index 10m.png
    41.3 KB · Views: 301
  • S&P500 Index 60m.png
    S&P500 Index 60m.png
    33.7 KB · Views: 335
  • S&P500 Index Daily.png
    S&P500 Index Daily.png
    35.2 KB · Views: 346
  • S&P500 Index weekly.png
    S&P500 Index weekly.png
    24.7 KB · Views: 292
S&P 500 = bearish set up given Trump plays down healthcare bill + his so called tax plan details on wednesday has been talked down as hot air once again

TRUMP = JOKER out of Batman. He's become the boy who cried wolf , unlike the ignorant voters, equity markets no longer buying it.


If French vote = bearish then we sell off hard, down to 2330 gap fill.
 

Attachments

  • S&P500 Index weekly.png
    S&P500 Index weekly.png
    23.7 KB · Views: 305
  • S&P500 Index Daily.png
    S&P500 Index Daily.png
    24.5 KB · Views: 302
  • S&P500 Index 10m.png
    S&P500 Index 10m.png
    33.7 KB · Views: 307
  • S&P500 Index 60m.png
    S&P500 Index 60m.png
    33.3 KB · Views: 309
S&P 500: Trading plan for 16/05/17

S&P 500 has held double top resistance thus far at 2404, this resistance is currently across multiple time frames thereby increasing its potency. The current political uncertainty surrounding Trump is expected to weigh on sentiment in the US trading session.

"President Trump revealed highly classified information to the Russian foreign minister and ambassador in a White House meeting last week, according to current and former U.S. officials, who said Trump’s disclosures jeopardized a critical source of intelligence on the Islamic State.

The information the president relayed had been provided by a U.S. partner through an intelligence-sharing arrangement considered so sensitive that details have been withheld from allies and tightly restricted even within the U.S. government, officials said."

Political turmoil will hurt Trumps ability to push through health care and tax reform, which in turn jeapordizes the TRUMP trade. Hence expect weakness in US equities with the unfilled gap below at 2391 being targeted.
 

Attachments

  • S&P500 Index weekly.png
    S&P500 Index weekly.png
    19.1 KB · Views: 311
  • S&P500 Index Daily.png
    S&P500 Index Daily.png
    21.7 KB · Views: 229
  • S&P500 Index 60m.png
    S&P500 Index 60m.png
    31.2 KB · Views: 312
  • S&P500 Index 10m.png
    S&P500 Index 10m.png
    34.1 KB · Views: 289
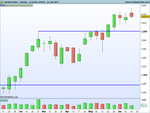
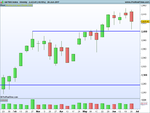
S&P 500: Trading plan for 22/05/17

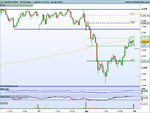
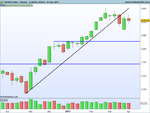
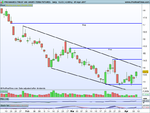
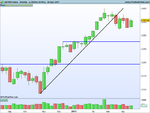
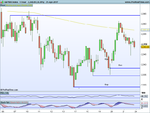
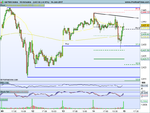
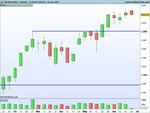
S&P 500 flushed on the weekly chart due to TRUMP/COMEY/FLYNN concerns regarding potential collusion with Russia. The investigation is pending with details still leaking via WAPO, the latest headlines from the Washington Post late friday was;

"amid this week’s revelations that Trump reportedly asked James Comey, when he was director of the Federal Bureau of Investigation, to drop its investigation into fired national security adviser Mike Flynn and his connections to Russia."

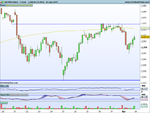
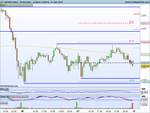
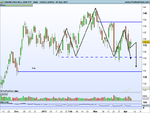
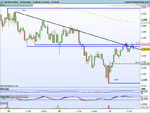
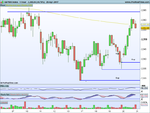
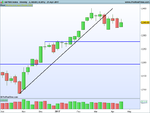
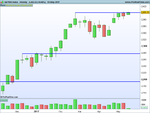
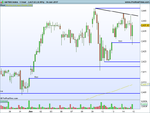
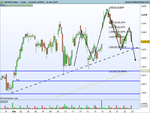
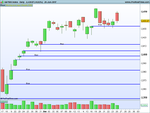
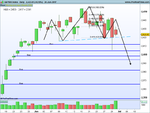
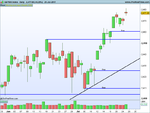
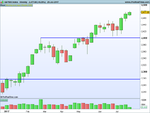
Concerns over Trumps being impeached and the potential derailment of tax reform and infrastructure spending hurt sentiment thereby sending the S&P 500 to a pivot low of 2348 gap fill. We have now stabilized and retraced 75% of that gap hitting 2388 thus far. The weekly chart still holds double top at 2404. Daily chart has held Fib 61% retrace thus far with an unfilled gap at 2401.

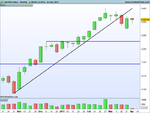
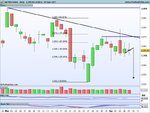
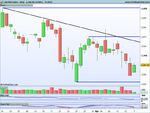
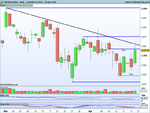
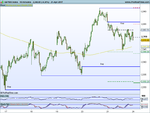
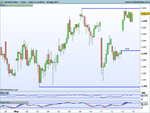
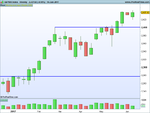
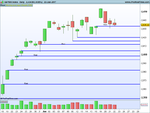
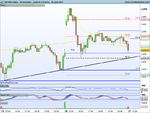
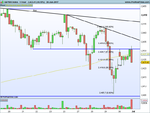
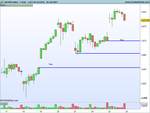
10 mins chart remains vulnerable given the unfilled gap at 2365 especially given North Korean test firing missiles again over w/e.

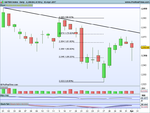
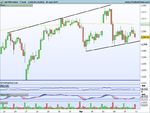
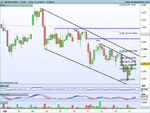
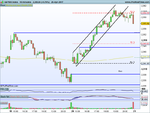
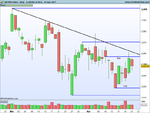
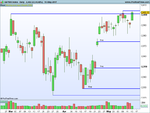
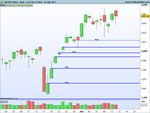
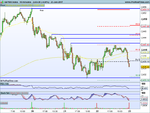
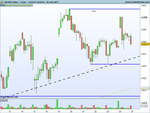
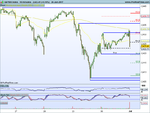
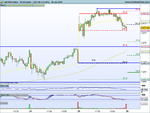
60 mins chart has held Fib 75% resistance after further reports from WAPO regarding the Trump investigation late friday.

"Former FBI Director James Comey will testify before the Senate Intelligence Committee in a public hearing sometime after Memorial Day. CNN reported this late Friday citing a Senate statement.

CNN also ran a story over the weekend citing an unidentified source that Comey will indicate Trump tried to influence him. This is making top headlines but please do keep in mind that the validity of these claims is unknown.

The source seemingly tries to provide context to last week’s Comey transcript that some took to suggest Comey didn’t feel influences. It claims Comey had reached “no conclusion about the President's intent before he was fired… But Comey did immediately recognize that the new President was not following normal protocols during their interactions.”

The father of Comey has also weighed in for a CNN interview.

J. Brien Comey believes his son's firing last week "a Trump deal." The 86-year old says: "[Comey] didn't give him 100% loyalty, and he demands that of people who work with him. [Comey] said he would give 100% honesty, but not loyalty.

On Saturday, the NYT reported that the Intelligence Committee is also seeking another testimony. “Michael Caputo, who served as a communications adviser to the Trump campaign, has been asked by the House committee investigating Russian election meddling to submit to a voluntary interview and to provide any documents he may have that are related to the inquiry.”

Concerns over North Korea will also weigh on Monday

"North Korea has fired another ballistic missile, according to various news agencies. South Korea first reported the test and according to BBC, "the White House said the medium-range missile had a shorter range than those used in North Korea's last three tests."

I will be looking to target the gap below at 2365 .
 
S&P 500: Trading plan for 15/06/17

S&P 500 is expected to gap lower on the WAPO story breaking overnight regarding Donald Trump being investigated for obstruction of justice.

"Federal investigation into Trump campaign’s ties to Russia has expanded to include whether the president tried to thwart it, the Washington Post reports"

Yellen's hawkish tone is also weighing on US equities as she talked down inflation and raised the prospect of starting tapering immediately. US futures are currently trading at 2420 zone , we have support at 2420 and 2416.
 

Attachments

  • S&P500 Index 10m.png
    S&P500 Index 10m.png
    43.4 KB · Views: 301
  • S&P500 Index 60m.png
    S&P500 Index 60m.png
    23.5 KB · Views: 297
  • S&P500 Index Daily.png
    S&P500 Index Daily.png
    19.7 KB · Views: 304
  • S&P500 Index weekly.png
    S&P500 Index weekly.png
    18.3 KB · Views: 252
H&S formation brewing on the 60 mins chart


Daily holding gap fill

Weekly chart looks exhausted
 

Attachments

  • S&P500 Index weekly.png
    S&P500 Index weekly.png
    19.3 KB · Views: 318
  • S&P500 Index Daily.png
    S&P500 Index Daily.png
    20 KB · Views: 308
  • S&P500 Index 60m.png
    S&P500 Index 60m.png
    43.2 KB · Views: 331
  • S&P500 Index 10m.png
    S&P500 Index 10m.png
    44.1 KB · Views: 291
S&P 500 TA update

S&P 500 TA update
 

Attachments

  • S&P500 Index weekly.png
    S&P500 Index weekly.png
    19.4 KB · Views: 313
  • S&P500 Index Daily.png
    S&P500 Index Daily.png
    20.2 KB · Views: 295
  • S&P500 Index 60m.png
    S&P500 Index 60m.png
    24.2 KB · Views: 294
  • S&P500 Index 10m.png
    S&P500 Index 10m.png
    47.6 KB · Views: 290
S&P 500: Trading plan for 03/07/17

S&P 500 is expected to gap up to 2435 , +12 handles from fridays close. The move higher in oil and Asia led by stronger Chinese data has helped risk sentiment but concerns over Trumps tweets, Qatar crisis , North Korea and hawkish central banks will weigh.

The daily chart of the S&P 500 has H&S formation pending with *the bearish engulfing candle on the 29th June still dominating.

60 mins chart had resistance at 2430, 2433 2435, 2443.

10 mins chart resistance at 2432-2435.
 

Attachments

  • S&P500 Index weekly.png
    S&P500 Index weekly.png
    19.3 KB · Views: 287
  • S&P500 Index Daily.png
    S&P500 Index Daily.png
    36.4 KB · Views: 312
  • S&P500 Index 60m.png
    S&P500 Index 60m.png
    36.1 KB · Views: 312
  • S&P500 Index 10m.png
    S&P500 Index 10m.png
    40.4 KB · Views: 360
Watch out for the 2 unfilled gaps below given its FOMC day, the perfect catalyst to close the gaps at 2470 and 2460.

Daily chart registers a doji candle indicating exhaustion/potential reversal.

10 mins double top resistance at 2481 is the zone to watch, if we surpass it then the bulls are back in control.
 

Attachments

  • S&P500 Index 10m.png
    S&P500 Index 10m.png
    40 KB · Views: 247
  • S&P500 Index Daily.png
    S&P500 Index Daily.png
    24.3 KB · Views: 303
  • S&P500 Index 60m.png
    S&P500 Index 60m.png
    17.6 KB · Views: 318
  • S&P500 Index weekly.png
    S&P500 Index weekly.png
    19.5 KB · Views: 290
Top