GBPUSD predictions for 11th July
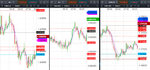
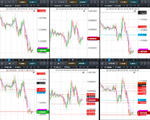
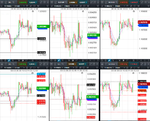
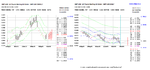
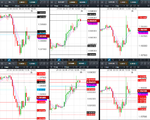
I attach the VRM predictions for GBPUSD for tonight and tomorrow finishing 5 pm 11th July in New York.
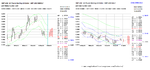
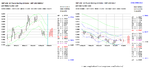
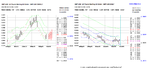
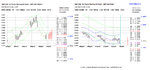
The predictions are now in chart format and CSV format for input into charting systems. Predictions are in the column format of date, high, low, close, trend channel top, bottom and middle and 24 dual columns for the VRM levels. The last entry gives today's predictions and this week's predictions. The CSV file also gives past results for the VRM for back testing trading strategies. As the current day and week have not finished, the high, low and close entries are set to zero for these dates. The FX chart corresponds to the last daily and weekly CSV file entries.
Documents describing the Volatility Response Model (VRM) and the chart format can be found on the first post of this thread.
Predictions for VRM levels of EURGBP and EURUSD and 10 other FX pairs can be found on the website
My current trading strategy is on post #157 of this thread.
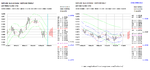
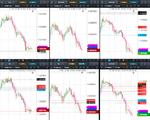
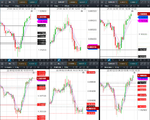
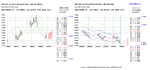
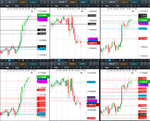
I attach the VRM predictions for GBPUSD for tonight and tomorrow finishing 5 pm 11th July in New York.
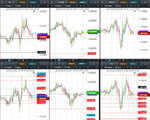
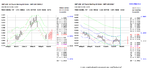
The predictions are now in chart format and CSV format for input into charting systems. Predictions are in the column format of date, high, low, close, trend channel top, bottom and middle and 24 dual columns for the VRM levels. The last entry gives today's predictions and this week's predictions. The CSV file also gives past results for the VRM for back testing trading strategies. As the current day and week have not finished, the high, low and close entries are set to zero for these dates. The FX chart corresponds to the last daily and weekly CSV file entries.
Documents describing the Volatility Response Model (VRM) and the chart format can be found on the first post of this thread.
Predictions for VRM levels of EURGBP and EURUSD and 10 other FX pairs can be found on the website
My current trading strategy is on post #157 of this thread.