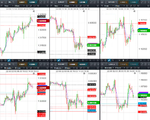
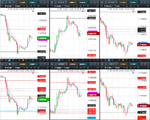
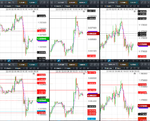
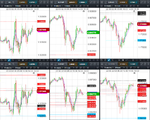
Predicting future FX support and resistance levels using mathematics

GBPUSD predictions for 28th June

I attach the VRM predictions for GBPUSD for tonight and tomorrow finishing 5 pm 28th June in New York.

The predictions are now in chart format and CSV format for input into charting systems. Predictions are in the column format of date, high, low, close, trend channel top, bottom and middle and 24 dual columns for the VRM levels. The last entry gives today's predictions and this week's predictions. The CSV file also gives past results for the VRM for back testing trading strategies. As the current day and week have not finished, the high, low and close entries are set to zero for these dates. The FX chart corresponds to the last daily and weekly CSV file entries.

Documents describing the Volatility Response Model (VRM) and the chart format can be found on the first post of this thread.

Predictions for VRM levels of EURGBP and EURUSD and 10 other FX pairs can be found on the website

My current trading strategy is on page #20 post #157 of this thread.
 

Attachments

  • gbpusd.PNG
    gbpusd.PNG
    61 KB · Views: 147
  • GBP-USD-DAILY.CSV
    46 KB · Views: 122
  • GBP-USD-WEEKLY.CSV
    46 KB · Views: 101
GBPUSD, EURGBP & EURUSD results for 28th June

Yesterday I attached the predicted support and resistance levels of GBPUSD of the Volatility Response Model (VRM) for today.

EURGBP and EURUSD VRM levels and 10 other FX pairs were on the website

Here are the results for GBPUSD, EURGBP & EURUSD.

TWO ATTACHMENTS

FIRST ATTACHMENT

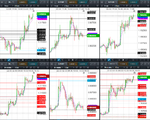
Weekly VRM levels in the top 30 minute charts, daily VRM levels in the bottom 30 minute charts. Times are GMT-4 . EMA channel (4,7) included.

GBPUSD was unable to rise above daily S1 sentiment level 1.3120

Once it fell through the lowest daily sentiment level 1.3107 it was completely bearish.

GBPUSD found support at the bottom of the long term trend channel at 1.3067 and rallied back to 1.3107

Then GBPUSD fell to weekly level 1.3054 before rallying back to 1.3107 then fell back to the bottom of the long term trend channel at 1.3067

SECOND ATTACHMENT

Weekly GBPUSD VRM levels in the top 5 minute charts, daily VRM levels in the bottom 5 minute charts. Times are GMT-4 . EMA channel (4,7) included.

Shows the rally from 1.3054 up to 1.3107 in more detail. The bottom of the short term trend channel was also 1.3053

===================================================================

There were some large gaps between VRM levels to trade between.
 

Attachments

  • 2018-06-28-GBPUSD-EURGBP-EURUSD-30min.png
    2018-06-28-GBPUSD-EURGBP-EURUSD-30min.png
    599.6 KB · Views: 203
  • 2018-06-28-GBPUSD-5min-1216.png
    2018-06-28-GBPUSD-5min-1216.png
    150.8 KB · Views: 159
GBPUSD predictions for 29th June

I attach the VRM predictions for GBPUSD for tonight and tomorrow finishing 5 pm 29th June in New York.

The predictions are now in chart format and CSV format for input into charting systems. Predictions are in the column format of date, high, low, close, trend channel top, bottom and middle and 24 dual columns for the VRM levels. The last entry gives today's predictions and this week's predictions. The CSV file also gives past results for the VRM for back testing trading strategies. As the current day and week have not finished, the high, low and close entries are set to zero for these dates. The FX chart corresponds to the last daily and weekly CSV file entries.

Documents describing the Volatility Response Model (VRM) and the chart format can be found on the first post of this thread.

Predictions for VRM levels of EURGBP and EURUSD and 10 other FX pairs can be found on the website

My current trading strategy is on page #20 post #157 of this thread.
 

Attachments

  • GBP-USD-WEEKLY.CSV
    46 KB · Views: 95
  • GBP-USD-DAILY.CSV
    46 KB · Views: 115
  • gbpusd.PNG
    gbpusd.PNG
    60.6 KB · Views: 155
GBPUSD, EURGBP & EURUSD results for 29th June - UK GDP

Thursday 28 June I attached the predicted support and resistance levels of GBPUSD of the Volatility Response Model (VRM) for yesterday 29th June

EURGBP and EURUSD VRM levels and 10 other FX pairs were on the website

Here are the results for GBPUSD, EURGBP & EURUSD on the day of the UK GDP announcement

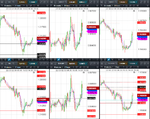
Weekly VRM levels in the top 1 hour charts, daily VRM levels in the bottom 30 minute charts. Times are GMT-4 . EMA channel (4,7) included.

At the start of the day GBPUSD made its low at the long term trend channel bottom at 1.3067

GBPUSD then cascaded up the VRM levels to reach its high for the day at daily level 1.3212

Meanwhile EURGBP started the day at its daily S1 sentiment level 0.8843 and rose to its short term trend channel top at 0.8888 where it then bounced down back to 0.8843

EURUSD followed GBPUSD from its low at daily S1 sentiment level 1.1564 and cascaded up through its VRM levels to weekly sentiment level 1.1682

There were some large gaps between VRM levels to trade between.
 

Attachments

  • 2018-06-29-GBPUSD-EURGBP-EURUSD-1hr-30min.png
    2018-06-29-GBPUSD-EURGBP-EURUSD-1hr-30min.png
    613.1 KB · Views: 178
GBPUSD predictions for 2nd July

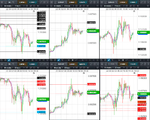
I attach the VRM predictions for GBPUSD for tonight and tomorrow finishing 5 pm 2nd July in New York.

The predictions are now in chart format and CSV format for input into charting systems. Predictions are in the column format of date, high, low, close, trend channel top, bottom and middle and 24 dual columns for the VRM levels. The last entry gives today's predictions and this week's predictions. The CSV file also gives past results for the VRM for back testing trading strategies. As the current day and week have not finished, the high, low and close entries are set to zero for these dates. The FX chart corresponds to the last daily and weekly CSV file entries.

Documents describing the Volatility Response Model (VRM) and the chart format can be found on the first post of this thread.

Predictions for VRM levels of EURGBP and EURUSD and 10 other FX pairs can be found on the website

My current trading strategy is on page #20 post #157 of this thread.
 

Attachments

  • GBP-USD-WEEKLY.CSV
    46 KB · Views: 107
  • GBP-USD-DAILY.CSV
    46 KB · Views: 111
  • gbpusd.PNG
    gbpusd.PNG
    61 KB · Views: 164
GBPUSD, EURGBP & EURUSD results for 2nd July

Yesterday I attached the predicted support and resistance levels of GBPUSD of the Volatility Response Model (VRM) for today.

EURGBP and EURUSD VRM levels and 10 other FX pairs were on the website

Here are the results for GBPUSD, EURGBP & EURUSD.

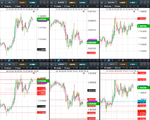
Weekly VRM levels in the top 30 minute charts, daily VRM levels in the bottom 30 minute charts. Times are GMT-4 . EMA channel (4,7) included.

GBPUSD rose to its high early at daily sentiment level 1.3210 then fell to its low at weekly level 1.3097.

During the fall GBPUSD had support for over 3 hours at 1.3150 but it had already broken down through the lowest daily S1 sentiment level at 1.3173. GBPUSD did rally back to this level but was immediately forced down.

EURGBP had support at its daily sentiment level 0.8836

EURUSD fell to its low at daily level 1.1589. On the way it found support at its short term trend channel middle at 1.1627.

There were some large gaps between VRM levels to trade between.
 

Attachments

  • 2018-07-02-GBPUSD-EURGBP-EURUSD-30min.png
    2018-07-02-GBPUSD-EURGBP-EURUSD-30min.png
    495.8 KB · Views: 151
GBPUSD predictions for 3rd July

I attach the VRM predictions for GBPUSD for tonight and tomorrow finishing 5 pm 3rd July in New York.

The predictions are now in chart format and CSV format for input into charting systems. Predictions are in the column format of date, high, low, close, trend channel top, bottom and middle and 24 dual columns for the VRM levels. The last entry gives today's predictions and this week's predictions. The CSV file also gives past results for the VRM for back testing trading strategies. As the current day and week have not finished, the high, low and close entries are set to zero for these dates. The FX chart corresponds to the last daily and weekly CSV file entries.

Documents describing the Volatility Response Model (VRM) and the chart format can be found on the first post of this thread.

Predictions for VRM levels of EURGBP and EURUSD and 10 other FX pairs can be found on the website

My current trading strategy is on page #20 post #157 of this thread.
 

Attachments

  • gbpusd.PNG
    gbpusd.PNG
    60.9 KB · Views: 172
  • GBP-USD-DAILY.CSV
    46 KB · Views: 104
  • GBP-USD-WEEKLY.CSV
    46 KB · Views: 97
GBPUSD, EURGBP & EURUSD results for 3rd July

Yesterday I attached the predicted support and resistance levels of GBPUSD of the Volatility Response Model (VRM) for today.

EURGBP and EURUSD VRM levels and 10 other FX pairs were on the website

Here are the results for GBPUSD, EURGBP & EURUSD.

TWO ATTACHMENTS

FIRST ATTACHMENT

Weekly VRM levels in the top 30 minute charts, daily VRM levels in the bottom 30 minute charts. Times are GMT-4 . EMA channel (4,7) included.

GBPUSD tested to lowest daily sentiment level at 1.3124 and bounced up to daily level 1.3196

Meanwhile EURUSD made its low at daily sentiment level 1.1630 and rose to its high at its highest daily sentiment level 1.1670

GBPUSD spent the rest of the day bouncing about its daily sentiment levels with EURGBP following about its daily sentiment levels

SECOND ATTACHMENT

Shows 5 minute charts and the price action of GBPUSD and EURGBP coordinating about their respective daily levels with EURUSD watching on.


There were some large gaps between VRM levels to trade between.
 

Attachments

  • 2018-07-03-GBPUSD-EURGBP-EURUSD-30min.png
    2018-07-03-GBPUSD-EURGBP-EURUSD-30min.png
    542.4 KB · Views: 158
  • 2018-07-03-GBPUSD-EURGBP-EURUSD-5min-1605.png
    2018-07-03-GBPUSD-EURGBP-EURUSD-5min-1605.png
    482.2 KB · Views: 149
GBPUSD predictions for 4th July

I attach the VRM predictions for GBPUSD for tonight and tomorrow finishing 5 pm 4th July in New York.

The predictions are now in chart format and CSV format for input into charting systems. Predictions are in the column format of date, high, low, close, trend channel top, bottom and middle and 24 dual columns for the VRM levels. The last entry gives today's predictions and this week's predictions. The CSV file also gives past results for the VRM for back testing trading strategies. As the current day and week have not finished, the high, low and close entries are set to zero for these dates. The FX chart corresponds to the last daily and weekly CSV file entries.

Documents describing the Volatility Response Model (VRM) and the chart format can be found on the first post of this thread.

Predictions for VRM levels of EURGBP and EURUSD and 10 other FX pairs can be found on the website

My current trading strategy is post #157 of this thread.
 

Attachments

  • GBP-USD-WEEKLY.CSV
    46 KB · Views: 100
  • GBP-USD-DAILY.CSV
    46 KB · Views: 116
  • gbpusd.PNG
    gbpusd.PNG
    61 KB · Views: 177
GBPUSD, EURGBP & EURUSD results for 4th July

Yesterday I attached the predicted support and resistance levels of GBPUSD of the Volatility Response Model (VRM) for today.

EURGBP and EURUSD VRM levels and 10 other FX pairs were on the website

Here are the results for GBPUSD, EURGBP & EURUSD.

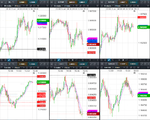
Weekly VRM levels in the top 1 hour charts, daily VRM levels in the bottom 30 minute charts. Times are GMT-4 . EMA channel (4,7) included.

GBPUSD started by rallying to its highest daily sentiment level 1.3222 before falling rapidly to daily S1 sentiment level 1.3177

Next came a rapid rise back to level 1.3222.

Finally the EMA channel broke through the weekly S1 sentiment level 1.3214 at 13:00.

GBPUSD high for the day at weekly sentiment level 1.3242

Meanwhile EURGBP found support on its short term trend channel middle 0.8801 and EURUSD found support on its lowest daily sentiment level 1.1631

There were some large gaps between VRM levels to trade between.
 

Attachments

  • 2018-07-04-GBPUSD-EURGBP-EURUSD-1hr-30min.png
    2018-07-04-GBPUSD-EURGBP-EURUSD-1hr-30min.png
    535 KB · Views: 200
GBPUSD predictions for 5th July

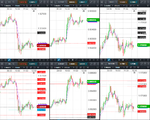
I attach the VRM predictions for GBPUSD for tonight and tomorrow finishing 5 pm 5th July in New York.

The predictions are now in chart format and CSV format for input into charting systems. Predictions are in the column format of date, high, low, close, trend channel top, bottom and middle and 24 dual columns for the VRM levels. The last entry gives today's predictions and this week's predictions. The CSV file also gives past results for the VRM for back testing trading strategies. As the current day and week have not finished, the high, low and close entries are set to zero for these dates. The FX chart corresponds to the last daily and weekly CSV file entries.

Documents describing the Volatility Response Model (VRM) and the chart format can be found on the first post of this thread.

Predictions for VRM levels of EURGBP and EURUSD and 10 other FX pairs can be found on the website

My current trading strategy is on post #157 of this thread.
 

Attachments

  • gbpusd.PNG
    gbpusd.PNG
    60.9 KB · Views: 98
  • GBP-USD-DAILY.CSV
    46 KB · Views: 83
  • GBP-USD-WEEKLY.CSV
    46 KB · Views: 72
Hi Everyone, My name is Graham and I am a mathematician here in Canada.

There are lots of different technical analysis methods to determine future support and resistance levels. They can be subjective and depend upon experience. I have been wondering whether support and resistance levels can be determined mathematically and now have a working algorithm I call the Volatility Response Model (VRM).

The VRM calculates future support and resistance levels either one day ahead or one week ahead, together with short and long term trend channels. These predictions are not extrapolations from the past. I attach a white paper describing the algorithm.

I am looking for FX traders for feedback, discussions and opinions on the VRM predictions. To this end I will post predictions in this thread as markets progress.

Here is the first set of predictions for GBPUSD in chart format starting 5 pm New York time tonight. The second attached paper describes the format of these predictions on the chart. They are essentially 24 weekly levels and 24 daily levels. The latter will last until 5 pm New York time tomorrow night. Tomorrow night after the close in New York I will post the GBPUSD market price action and the VRM levels on the same chart.

Hey very interesting post. I have a question. How can your algorythm calculate the supports and ressistances if it's not depending on previous price levels? I mean I always determine support and ressistance levels where I see price rejected or reversed multiple times. Can u write me down how does this works?
 
Hey very interesting post. I have a question. How can your algorythm calculate the supports and ressistances if it's not depending on previous price levels? I mean I always determine support and ressistance levels where I see price rejected or reversed multiple times. Can u write me down how does this works?

Hi chartman89 thank you for your question.

The VRM levels you see each day are calculated using all the historical high, low, close data I can get my hands on. Some of it goes back to the 1990's. Essentially there is a mathematical function, very very non-linear (no straight lines involved at all) that relates one candlestick (high, low, close) to the next candlestick (high, low, close). This mathematical function stays the same regardless of which candlestick pairs you choose in all the historical data.

The next step is to use this mathematics to calculate the next candlestick in the future. This is done for 1 day candlesticks, 2 day candlesticks, ...right out to 8 day candlesticks. At each timescale there will be a high, low and SENTIMENT level calculated. So that means there are 24 levels each day to look at. Often these levels are duplicated or 2 basis points apart so you can reduce the number of levels considerably.

The same maths is used to look at weekly candlestick data. So there are 24 weekly level to use as well.

That's an overview of the VRM

I wrote down a trading strategy at post #157 of this thread.
 
GBPUSD, EURGBP & EURUSD results for 5th July

Yesterday I attached the predicted support and resistance levels of GBPUSD of the Volatility Response Model (VRM) for today.

EURGBP and EURUSD VRM levels and 10 other FX pairs were on the website

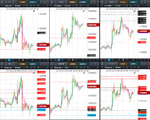
Here are the results for GBPUSD, EURGBP & EURUSD.

TWO ATTACHMENTS

FIRST ATTACHMENT

Weekly VRM levels in the top 30 minute charts, daily VRM levels in the bottom 30 minute charts. Times are GMT-4 . EMA channel (4,7) included.

GBPUSD started the day with support on its daily S1 sentiment level at 1.3220;

Similarly EURUSD started the day with support on its daily S1 sentiment level 1.1656.

GBPUSD followed EURUSD to its high at daily level 1.1718. GBPUSD high was at its highest daily sentiment level 1.3268

GBPUSD fell to its low with support over 5 hours at its weekly S1 sentiment level 1.3214

SECOND ATTACHMENT

Shows 5 minute charts about the time GBPUSD fell from its high

There were some large gaps between VRM levels to trade between.
 

Attachments

  • 2018-07-05-GBPUSD-EURGBP-EURUSD-5min-1215.png
    2018-07-05-GBPUSD-EURGBP-EURUSD-5min-1215.png
    388.8 KB · Views: 115
  • 2018-07-05-GBPUSD-EURGBP-EURUSD-30min.png
    2018-07-05-GBPUSD-EURGBP-EURUSD-30min.png
    577.2 KB · Views: 83
GBPUSD predictions for 6th July

I attach the VRM predictions for GBPUSD for tonight and tomorrow finishing 5 pm 6th July in New York.

The predictions are now in chart format and CSV format for input into charting systems. Predictions are in the column format of date, high, low, close, trend channel top, bottom and middle and 24 dual columns for the VRM levels. The last entry gives today's predictions and this week's predictions. The CSV file also gives past results for the VRM for back testing trading strategies. As the current day and week have not finished, the high, low and close entries are set to zero for these dates. The FX chart corresponds to the last daily and weekly CSV file entries.

Documents describing the Volatility Response Model (VRM) and the chart format can be found on the first post of this thread.

Predictions for VRM levels of EURGBP and EURUSD and 10 other FX pairs can be found on the website

My current trading strategy is on post #157 of this thread.
 

Attachments

  • gbpusd.PNG
    gbpusd.PNG
    61.1 KB · Views: 95
  • GBP-USD-DAILY.CSV
    46 KB · Views: 87
  • GBP-USD-WEEKLY.CSV
    46 KB · Views: 81
GBPUSD, EURGBP & EURUSD results for 6th July - US Non Farm Payroll

Yesterday I attached the predicted support and resistance levels of GBPUSD of the Volatility Response Model (VRM) for today.

EURGBP and EURUSD VRM levels and 10 other FX pairs were on the website

Here are the results for GBPUSD, EURGBP & EURUSD. US Non Farm Payroll day

TWO ATTACHMENTS

FIRST ATTACHMENT

Weekly VRM levels in the top 30 minute charts, daily VRM levels in the bottom 30 minute charts. Times are GMT-4 . EMA channel (4,7) included.

GBPUSD low for the day was at its short term trend channel middle 1.3208.

Prior to the NFP GBPUSD retraced back to its daily S1 sentiment level 1.3225

EURUSD low for the day was at daily sentiment level 1.1681. Using the 30 minute EMA(4,7) then EURUSD was always bullish right through the NFP up to its high at weekly level 1.1770

EURUSD's high for the day stopped GBPUSD in its tracks but later in the afternoon GBPUSD rallied to its daily H level 1.3286

Meanwhile EURGBP found support at its daily S1 level 0.8837

SECOND ATTACHMENT

Shows the 5 minute charts about the NFP

There were some large gaps between VRM levels to trade between.
 

Attachments

  • 2018-07-06-GBPUSD-EURGBP-EURUSD-5min-1235.png
    2018-07-06-GBPUSD-EURGBP-EURUSD-5min-1235.png
    484.1 KB · Views: 116
  • 2018-07-06-GBPUSD-EURGBP-EURUSD-30min.png
    2018-07-06-GBPUSD-EURGBP-EURUSD-30min.png
    494.7 KB · Views: 140
GBPUSD predictions for 9th July

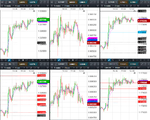
I attach the VRM predictions for GBPUSD for tonight and tomorrow finishing 5 pm 9th July in New York.

The predictions are now in chart format and CSV format for input into charting systems. Predictions are in the column format of date, high, low, close, trend channel top, bottom and middle and 24 dual columns for the VRM levels. The last entry gives today's predictions and this week's predictions. The CSV file also gives past results for the VRM for back testing trading strategies. As the current day and week have not finished, the high, low and close entries are set to zero for these dates. The FX chart corresponds to the last daily and weekly CSV file entries.

Documents describing the Volatility Response Model (VRM) and the chart format can be found on the first post of this thread.

Predictions for VRM levels of EURGBP and EURUSD and 10 other FX pairs can be found on the website

My current trading strategy is on post #157 of this thread.
 

Attachments

  • gbpusd.PNG
    gbpusd.PNG
    60.8 KB · Views: 74
  • GBP-USD-DAILY.CSV
    46 KB · Views: 90
  • GBP-USD-WEEKLY.CSV
    46 KB · Views: 70
GBPUSD, EURGBP & EURUSD results for 9th July

Yesterday I attached the predicted support and resistance levels of GBPUSD of the Volatility Response Model (VRM) for today.

EURGBP and EURUSD VRM levels and 10 other FX pairs were on the website

Here are the results for GBPUSD, EURGBP & EURUSD.

TWO ATTACHMENTS

FIRST ATTACHMENT

Weekly VRM levels in the top 30 minute charts, daily VRM levels in the bottom 30 minute charts. Times are GMT-4 . EMA channel (4,7) included.

GBPUSD initially had support on weekly S1 sentiment level 1.3290.

GBPUSD high at daily level 1.3364

On announcement of resignation of Boris Johnson UK Foreign Secretary, GBPUSD tumbled from weekly sentiment level 1.3351 down to the middle of its short term trend channel at 1.3213

Then rallied to the daily S1 sentiment level 1.3269

Meanwhile EURGBP had support at weekly S1 sentiment level 0.8814 and resistance at weekly level 0.8895

EURUSD had a high at weekly sentiment level 1.1789 and a low at weekly S1 sentiment level 1.1732

SECOND ATTACHMENT

Shows the 10 minute charts about the resignation of Boris Johnson UK Foreign Secretary

There were some large gaps between VRM levels to trade between.
 

Attachments

  • 2018-07-09-GBPUSD-EURGBP-EURUSD-10min-1535.png
    2018-07-09-GBPUSD-EURGBP-EURUSD-10min-1535.png
    608.5 KB · Views: 85
  • 2018-07-09-GBPUSD-EURGBP-EURUSD-30min.png
    2018-07-09-GBPUSD-EURGBP-EURUSD-30min.png
    527.6 KB · Views: 75
GBPUSD predictions for 10th July

I attach the VRM predictions for GBPUSD for tonight and tomorrow finishing 5 pm 10th July in New York.

The predictions are now in chart format and CSV format for input into charting systems. Predictions are in the column format of date, high, low, close, trend channel top, bottom and middle and 24 dual columns for the VRM levels. The last entry gives today's predictions and this week's predictions. The CSV file also gives past results for the VRM for back testing trading strategies. As the current day and week have not finished, the high, low and close entries are set to zero for these dates. The FX chart corresponds to the last daily and weekly CSV file entries.

Documents describing the Volatility Response Model (VRM) and the chart format can be found on the first post of this thread.

Predictions for VRM levels of EURGBP and EURUSD and 10 other FX pairs can be found on the website

My current trading strategy is on post #157 of this thread.
 

Attachments

  • gbpusd.PNG
    gbpusd.PNG
    60.9 KB · Views: 95
  • GBP-USD-DAILY.CSV
    46 KB · Views: 76
  • GBP-USD-WEEKLY.CSV
    46 KB · Views: 69
GBPUSD, EURGBP & EURUSD results for 10th July

Yesterday I attached the predicted support and resistance levels of GBPUSD of the Volatility Response Model (VRM) for today.

EURGBP and EURUSD VRM levels and 10 other FX pairs were on the website

Here are the results for GBPUSD, EURGBP & EURUSD.

Weekly VRM levels in the top 30 minute charts, daily VRM levels in the bottom 30 minute charts. Times are GMT-4 . EMA channel (4,7) included.

GBPUSD low for the day was at the short term trend channel middle 1.3226

The GBPUSD then rose to its high for the day at weekly S1 sentiment level 1.3290

Then fell back again to the short term trend channel middle 1.3226

Spent the rest of the day ricocheting inside the daily sentiment levels

There were some large gaps between VRM levels to trade between.
 

Attachments

  • 2018-07-10-GBPUSD-EURGBP-EURUSD-30min.png
    2018-07-10-GBPUSD-EURGBP-EURUSD-30min.png
    600.5 KB · Views: 283
Top