GBPUSD, EURGBP & EURUSD results for 3rd August - US Non Farm Payroll
Here are the results for GBPUSD, EURGBP & EURUSD.
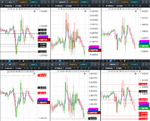
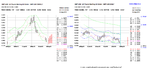
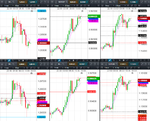
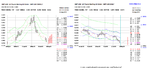
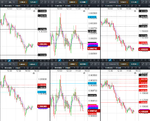
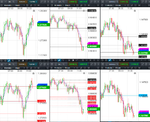
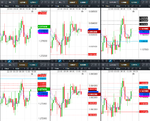
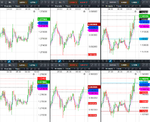
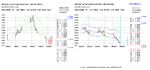
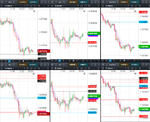
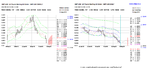
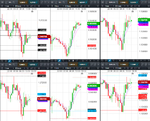
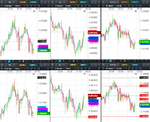
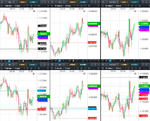
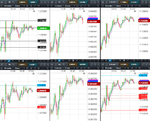
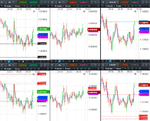
Weekly VRM levels in the top minute, daily VRM levels in the bottom 30 minute charts. Times are GMT-4 . EMA channel (4,7) included.
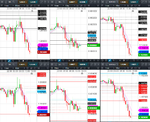
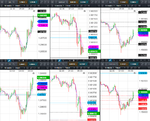
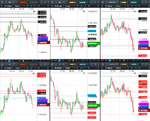
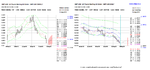
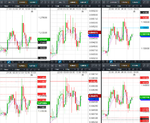
GBPUSD spent the day trapped in its six weekly levels and below its daily S1 sentiment level 1.3026
EURUSD spent the day trapped within its daily sentiment levels. EURUSD could not decide whether it was bullish or bearish at the daily timescales.
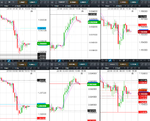
Here are the results for GBPUSD, EURGBP & EURUSD.
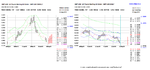
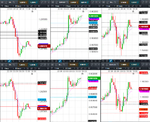
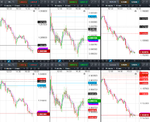
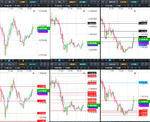
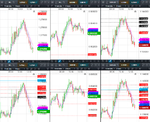
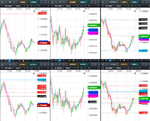
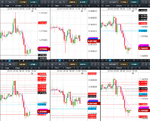
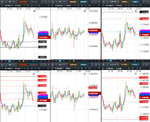
Weekly VRM levels in the top minute, daily VRM levels in the bottom 30 minute charts. Times are GMT-4 . EMA channel (4,7) included.
GBPUSD spent the day trapped in its six weekly levels and below its daily S1 sentiment level 1.3026
EURUSD spent the day trapped within its daily sentiment levels. EURUSD could not decide whether it was bullish or bearish at the daily timescales.