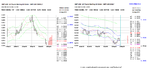
GBPUSD, EURGBP & EURUSD results for 17th August
Yesterday I attached the predicted support and resistance levels of GBPUSD of the Volatility Response Model (VRM) for today.
EURGBP and EURUSD VRM levels and 10 other FX pairs were on the website
Here are the results for GBPUSD, EURGBP & EURUSD.
FOUR ATTACHMENTS
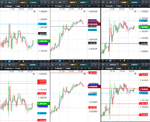
FIRST ATTACHMENT
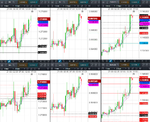
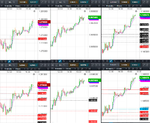
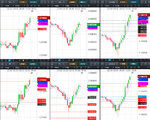
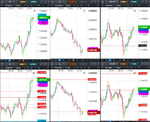
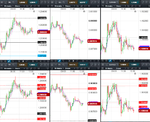
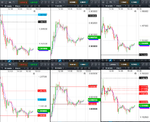
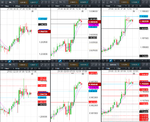
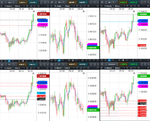
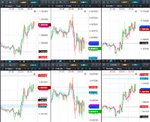
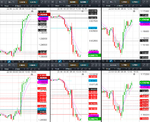
Weekly VRM levels in the top 1 hour charts, daily VRM levels in the bottom 1 hour charts. Times are GMT-4 . EMA channel (4,7) included.
GBPUSD low for the day at weekly level 1.2699
EURUSD low for the day at daily S1 sentiment level 1.1370
EURUSD spent at least 5 hours trying to break through its daily level 1.1413
EURUSD high for the day at daily level 1.1443
EURGBP low for the day at daily S1 sentiment level 0.8938
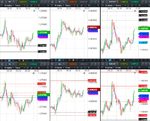
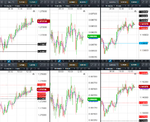
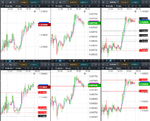
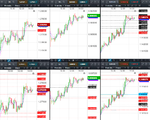
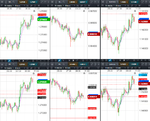
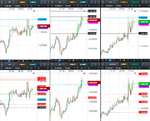
LAST 3 ATTACHMENTS
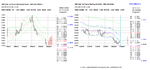
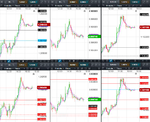
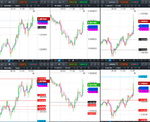
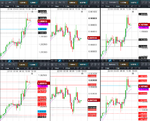
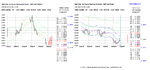
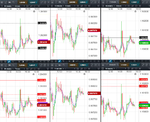
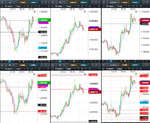
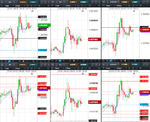
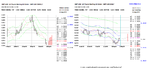
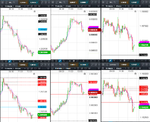
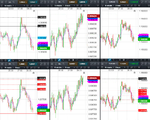
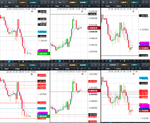
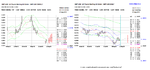
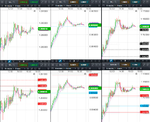
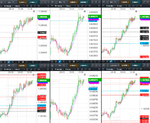
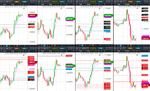
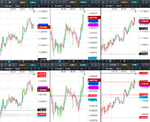
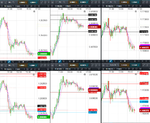
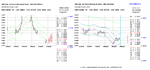
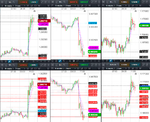
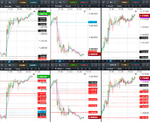
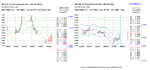
Show 10 minute charts for the 3 FX through the day as they navigate their respective VRM levels
There were some large gaps between VRM levels to trade between.
Yesterday I attached the predicted support and resistance levels of GBPUSD of the Volatility Response Model (VRM) for today.
EURGBP and EURUSD VRM levels and 10 other FX pairs were on the website
Here are the results for GBPUSD, EURGBP & EURUSD.
FOUR ATTACHMENTS
FIRST ATTACHMENT
Weekly VRM levels in the top 1 hour charts, daily VRM levels in the bottom 1 hour charts. Times are GMT-4 . EMA channel (4,7) included.
GBPUSD low for the day at weekly level 1.2699
EURUSD low for the day at daily S1 sentiment level 1.1370
EURUSD spent at least 5 hours trying to break through its daily level 1.1413
EURUSD high for the day at daily level 1.1443
EURGBP low for the day at daily S1 sentiment level 0.8938
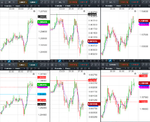
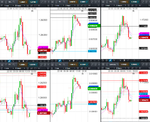
LAST 3 ATTACHMENTS
Show 10 minute charts for the 3 FX through the day as they navigate their respective VRM levels
There were some large gaps between VRM levels to trade between.