GBPUSD, EURGBP & EURUSD results for 11th September
Yesterday I attached the predicted support and resistance levels of GBPUSD of the Volatility Response Model (VRM) for today.
EURGBP and EURUSD VRM levels and 11 other FX pairs were on the website
Here are the results for GBPUSD, EURGBP & EURUSD.
FOUR ATTACHMENTS
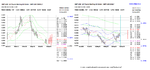
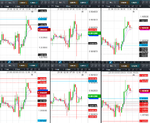
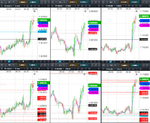
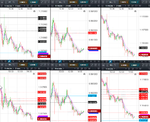
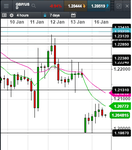
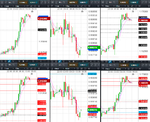
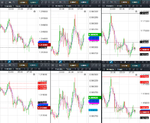
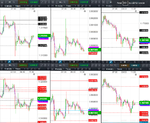
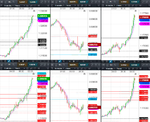
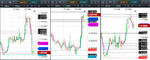
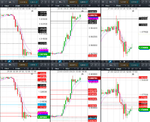
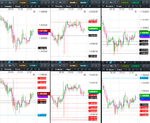
FIRST ATTACHMENT
Weekly VRM levels in the top 1 hour charts, daily VRM levels in the bottom 1 hour charts. Times are GMT-4 . EMA channel (4,7) included.
GBPUSD high for the day at daily level 1.3086 and low for the day at short term trend channel middle 1.2973
EURUSD high for the day at weekly level 1.1641 and low for the day at its lowest daily sentiment level 1.1569
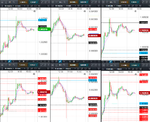
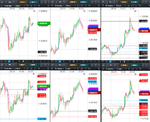
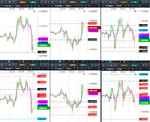
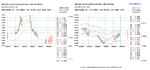
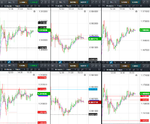
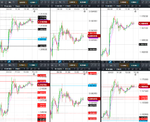
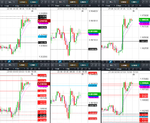
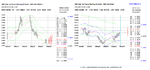
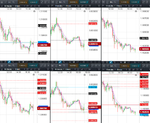
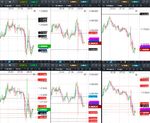
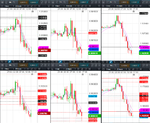
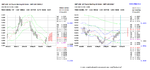
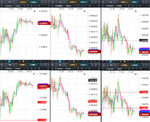
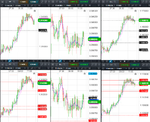
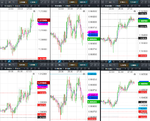
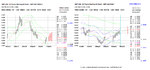
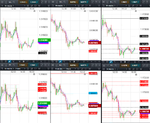
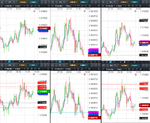
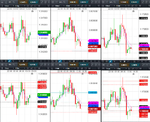
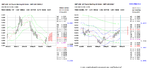
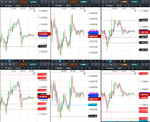
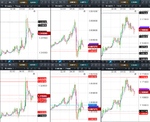
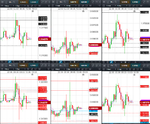
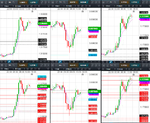
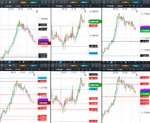
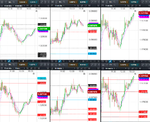
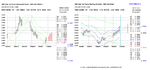
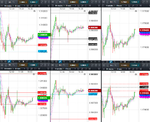
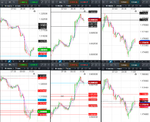
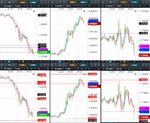
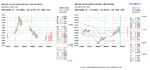
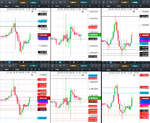
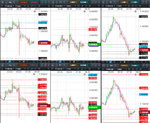
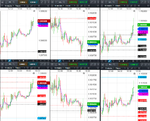
LAST 3 ATTACHMENTS
Show 10 minute charts for the 3 FX through the day as they navigate their respective VRM levels
There were some large gaps between VRM levels to trade between.
Yesterday I attached the predicted support and resistance levels of GBPUSD of the Volatility Response Model (VRM) for today.
EURGBP and EURUSD VRM levels and 11 other FX pairs were on the website
Here are the results for GBPUSD, EURGBP & EURUSD.
FOUR ATTACHMENTS
FIRST ATTACHMENT
Weekly VRM levels in the top 1 hour charts, daily VRM levels in the bottom 1 hour charts. Times are GMT-4 . EMA channel (4,7) included.
GBPUSD high for the day at daily level 1.3086 and low for the day at short term trend channel middle 1.2973
EURUSD high for the day at weekly level 1.1641 and low for the day at its lowest daily sentiment level 1.1569
LAST 3 ATTACHMENTS
Show 10 minute charts for the 3 FX through the day as they navigate their respective VRM levels
There were some large gaps between VRM levels to trade between.
Attachments
Last edited: