Hi,
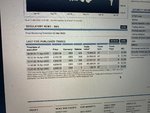
Really hoping you guys can help as I recently purchased 215qty of 2AMZ at 4637 with Hargreaves Lansdowne and set a stop loss of 4350 (approx 5% lower). The ETP is offered by a company called leverage shares .com (all one word).
I have been told that the stop loss hit and my position was sold, however none of the charts are showing this to be the case and I feel there has been some kind of an error. Not only did the stop loss trigger even though the price for this stock continued to rise all day from the moment I purchased it, it sold for 2704 approximately 40-45% below the price.
I also had exactly the same thing happen with the same stock around 30 minutes later in my ISA account where I had bought the same stock.
Please can somebody advise how this is possible as I have lost a lot of money.