'No indicators' revisited

skim,
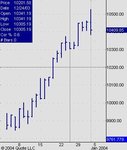
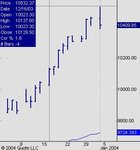
What setting are you using? I was looking for an outside reversal today,which according to my charts didn't occur.We had a low on 31/12 of 10382, today just touched above this for a low of 10384.Are my charts correct??
An outside reversal would have been an even stronger signal??

thanks
 
Last edited:
skim,
just looked again at your chart.The bar before todays doesn't appear to show that drop to 10382 on New Years Eve.Am i missing something?
 
Not sure steve. The daily chart on Qcharts was missing data (the holidays tend to screw it up for a day or so), so I used the data from TC2000. I updated it just before I posted the chart.

The TC2000 data/chart may be incorrect, in which case I take back all I said in the post! LOL

Just wound Qcharts up again, and the daily data for INDU is as follows:
 

Attachments

  • dj daily.jpg
    dj daily.jpg
    19.7 KB · Views: 620
Skim, may a thousand mice desend upon your head..... You have transgressed to the light side. Shame on you. You have dared to show a 4 slope change using trend lines, signalling a possible end of the rally.... So Shall I post the ND PD top bottom on today's action to really rub it in?
Sorry, I forgot. I am on holiday, so I can't. :cheesy:
 
LOL

I knew that would get you out of hiding. :cheesy:

I actually saw this by eye, but decided to put trendlines on to show - notice though that my description was messy, which just goes to show how infrequently I use it.

As a320 said, you're definitely lurking here more than you used to! Nuff said? LOL
 
steve - I think it must be because I'm showing INDU, and you're showing DJI.

This is my Qcharts daily data for DJI (the one above is INDU): Note the data holes!
 

Attachments

  • dji daily.jpg
    dji daily.jpg
    16.9 KB · Views: 525
Chartman is a very frequent visitor :cheesy:

Here an example of underbalancing corrections..always a good sign for continuation in a multiple wave set :cool:
I haven't included the fib's of the corrections to keep it straight forward for now ;)

ES04H 5min

CJ

Same colour as the mods now :cheesy:
 

Attachments

  • asicme-es04h- 5 minute balancing.jpg
    asicme-es04h- 5 minute balancing.jpg
    152.1 KB · Views: 576
Last edited:
Steve,

I think the high and low on the bigcharts chart is calculated using the old method of taking the actual high and low of all the stocks to make a theoretical high and low for the day. This makes the highs higher and the lows lower than we see on most charts.

I just ignore bigcharts and if you want another free chart, this one is quite good. It is delayed so it is not up to date at the close:-

http://tinyurl.com/293yy
 
Last edited:
No such holes with Sierra/MyTrack... OHLC too :( I feel the force of the dark side.....nearly :cheesy:
 

Attachments

  • indu daily.gif
    indu daily.gif
    6.2 KB · Views: 546
BB,CM,Skim
many thanks.....looks like i need to revise my chart sources..any suggestions??.....no wonder my pivot levels were out of sync when i used Bigcharts OHLC info....

cheers
 
BB,
many thanks.I did use that site previously but it had the habit of freezing with other applets open.Perhaps I won't open so many in future.

Oatman,
going by the charts posted by Skim and CM yesterday was a key reversal down.The definition is taking out the previous days high,then close below the previous days low.On a couple of data sources though i'm still getting a low on 31/12 of 10382,which if correct invalidates this,as yesterdays low appears to be 10384.


cheers
 
Top