You are using an out of date browser. It may not display this or other websites correctly.
You should upgrade or use an alternative browser.
You should upgrade or use an alternative browser.
'No indicators' revisited
- Thread starter ford
- Start date
- Watchers 53
Channels - Try this:
Buy 2 at the bottom. Sell 1 at the top. Buy 2 at the bottom (now long 3), sell 1 at (near) the top. etc. Trail stop along the bottom of the channel.
This way you are profiting on each leg, while also holding on for the long term move with patience. If it happens you've made a lot of money. If it doesn't, you've still made some money. You build your long term position as the channel moves, while also taking a chunk home on the legs.
No waves, no theory, just intuition and jiving with the beat of the market.
Trade management and managing yourself are where you make your money. Knowing how to manage your trade according to what tune the market is playing separates the men from the boys, and something few ever seem to post about as its not widley known.
It would make a good thread, but its handed down from Jedi to Jedi on a need to know basis only. Sorry about that.
😉
Last edited:
Hi all, apologies for any break in the natural flow of this thread, but I'd just like to say how very useful it has been for me.
I'm a real beginner and wasn't getting on too well with the plethora of indicators and systems that I was studying. There was just too much and too many. And the more assiduously I studied them, the more they managed to give me completely contradictory indications of the market's action. Of course, that may just have been my 'green'-ness in interpreting them.
However, this indicator-less trading is a real find and I want to thank all who contribute. I'm afraid my inputs will be negligible for obvious reasons. When I get to the point where I can understand 10% of what's going on in here, I'll be opening the champagne.
Cheers!!!
Rognvald
Established member
- Messages
- 916
- Likes
- 15
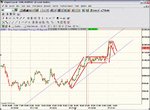
I don't want to cloud the issue with channels here when I'm trying to get away from them but it all depends on timeframe. The last chart posted shows a channel established on a daily basis. If you then look intraday you see several channels over this period.
If you look further you can see channels within these channels.
It is a question of time and movement I think and of course how much of each dictates profitability or otherwise. I have again superimposed on those of others.
I am trying to get comfortable with visualising these various movements as they are without this "support"
Attachments
Skim,
If you get a minute to look at Rog chart could you tell us what is it that might alert you to an entry at the at the 'intended' support line on that chart apart that is from the very strong rejection bar?
Actually I have it or I think I might do..would you have been looking at the weakness in those downbars in comparison to prior bottoms? By weakness I mean they were not closing down strongly were they.
Cheers
BBB said:Trade management and managing yourself are where you make your money. Knowing how to manage your trade according to what tune the market is playing separates the men from the boys, and something few ever seem to post about as its not widley known.
It would make a good thread, but its handed down from Jedi to Jedi on a need to know basis only. Sorry about that.
Again a small very specific sample of the methods used when trading a geo signal point...
a320 said:1: Enter your trade.
2 :If the trade is a breakout trade place your stoploss 1 point inside the breakout point . In the case of buying or selling a retracement level , double top or double bottom place your stoploss 1 point outside the signal point. False breaks should be no more than 2 ticks on a Geometric level.
3: If the trade moves quickly into profit by more than 2 points move your stoploss to break even.
4: If the market continues to move in your favour. As each new 5 minute bar starts registering move your stoploss to the extreme point +/- 1 tick of the prior bar . This ensures that you will stay on the move if each new bar makes a lower high or a higher low than the preceding bar.
5: In the case of a fast move , move your stop loss to the 50% level of the prior 5 minute bar .This ensures that even if the market reverses fast you will not lose all your profit.
6 : Let the market take you out unless you identify a solid reversal level.
I know people have varied views on stops but each to their own.. see what you think & again make up your own minds...
CJ
Last edited:
Here's my input as an apprentice to this fine art!
It's all well and good talking of position sizing etc, and staged exits of so many contracts. Whereas this may be a point to which most of us here aspire, I believe it is probably beyond most of us for the moment. I for one have been having a lot of psyche issues lately, but have recently reduced my position size and it has helped enormously. I'm not talking of numbers of contracts here, as I was only trading one ES contract. I have found that reducing to only $20 a point has removed a huge amount of "noise" and I am now able to participate as opposed to spectate!
I hate to admit it but reading some of clylbw's posts was really getting to me as I could not see how they were holding for so long as a newbie in this game. Anyway I am now able to see things a bit clearer now and can move forward.
This may be a bit controversial, but I am amazed at how so many seem to want to buy the low and sell the high! Surely, as mere mortals in this game who can participate at levels previously unheard of, before technology, we should be happy just to take a slice of the pie no matter how big or small? I saw 800 contracts go through on ES the other day - that's a total order value of around $44M!! Now if I can play this game amongst that lot and still win a few points then I reckon that's pretty good going!
Chump - as far as the exit is concerned, I would have been more than happy to stay on the trend until the top of the fifth wave at about 10120. This I believe is a good exit at the lower high signal, after the third wave of a three stage push. You can always wait for another signal and get back in again. 😉
Hope this helps a little!
Cheers
Q
F
ford
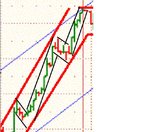
Rognvald said:And to drill down even further
Hi Rognvald,
Those channels are all very good, but were they drawn on as the event unfolded or with benefit of hindsight?
I found that drawing channels on without 3 points was near impossible on such a micro level.
Ofcourse its easy after the even because the degree at which the rise takes place is visible.
Rognvald
Established member
- Messages
- 916
- Likes
- 15
Ford
The first I drew on I was able to identify as it was. The other smaller ones are done with hindsight. My point I supose is that we need to look at the timeframe we are trying to analyse. On the chart with the day's move up it would have been great to be in it the whole way. I wasn't in at all but merely watching. I'm just trying to draw attention to the "chaotic & fractal" nature of the price moves and saying it depends what size moves we want to try to isolate.
The first I drew on I was able to identify as it was. The other smaller ones are done with hindsight. My point I supose is that we need to look at the timeframe we are trying to analyse. On the chart with the day's move up it would have been great to be in it the whole way. I wasn't in at all but merely watching. I'm just trying to draw attention to the "chaotic & fractal" nature of the price moves and saying it depends what size moves we want to try to isolate.
F
ford
Rognvald said:Ford
The first I drew on I was able to identify as it was. The other smaller ones are done with hindsight. My point I supose is that we need to look at the timeframe we are trying to analyse. On the chart with the day's move up it would have been great to be in it the whole way. I wasn't in at all but merely watching. I'm just trying to draw attention to the "chaotic & fractal" nature of the price moves and saying it depends what size moves we want to try to isolate.
Ah ok, I understand and agree! I just wanted to clear that up, because if you knew I wanted to know how you did it. 😆
Similar threads
- Replies
- 1
- Views
- 5K
- Replies
- 0
- Views
- 2K
- Replies
- 412
- Views
- 97K