GirlPower said:
A little nervous at exposing my complete lack of knowledge on this forum, but I'd appreciate your comments.
I'm not trading at the moment, just learning. Following the advice by everyone here, I selected just one stock at random yesterday to see if I could 'see' for myself what you might be talking about.
I probably should keep quiet a while longer, but feel direct involvement would be more helpful - for me, anyway.
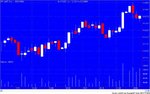
On the 5 minute chart for SPY, I noticed there was increasing volume with each downward move until about 18:35.
Then there was a long white candle with a low at the previous low, but a high above any of the previous 6 bars. More importantly, I think, is that it is the first upward move that has been accompanied by increasing volume since the trading session started.
Nothing dramatic happened immediately, but it does from that point rise upward to finish 40 points up from that large white candle on higher volume.
I did follow this as it happened, honestly, but it's much easier to see it in retrospect.
My questions are; am I being too simplistic with this interpretation, is it a correct interpretation and am I discussing this in the right place?
Good morning Felicity,
What you must cultivate, is the ability to sort out what applies and what does not. I will explain how you do this.
The most imporatant part in the whole excercise is the mental posture that you adopt
when looking at a chart.. This, for the reckless and impatient seems an arcane
statement.
Because all of this is abstract and intangible, it is sometimes very difficult to explain in one go.
You must not look at a chart as a flat inert thing.
You must consider what you see in the chart to have more than one dimension, as if what you are looking at is a solid, with depth to it as well.
Therefore you must cultivate the ability to look INTO and not AT, in order to get INTO IT and not be AT IT, like a passer by looking at a poster on the wall, You want to be IN the poster, not out of it. Are you able to get my drift so far ?
When you are able to do this, it is as if you are inside it, as part of what is going on, now not as an observer but as a participant, do you see ?
You now evolve from being a baffled observer to being an intuitively empowered participant, and it does not matter what size you are dealing, alongside all the other participants, some v small, others huge, rather like being on the motorway in a passenger car and sharing the road with motorbikes, vans, buses, heavy lorries, cesspool emptiers, cement mixers, ambulances, fire engines, tankers, jeeps,and other passenger cars.
You are all motorists aren't you ?
You are either going in one direction or another aren't you ? The key thing is that you have to be AWARE ot he traffic, but the traffic itself does not prevent you from reaching your destination, but you must be AWARE of the behaviour of other motorists in order to get home safely as you originally planned.
Therefore what you must concentrate on is developing an awareness of what is happening and what to do about it, within a living organism that has dimensions instead of a map, which is just flat.
Now let us go to your chart. At 1815 after a sharp fall, you will see that the red candle has a long bottom tail and the volume is not insignificant. This has to be buying. Now look carefully to see what happens next. There is a bit of volatility. But look carefully again. Look...There is a reluctance to drop below 12300, is there not ? Why is this ? The price is being prevented from falling below this level, but allowed to "flirt" with it. This is because some buying is underpinnig the support. Now we see that prices begin to lift. But they don't lift conclusively, do they ? It all looks very half hearted, it is a "pretend" sort of rise si it not ?
The clue is the spreads are very narrow, because there is not any urgency to take the price up, also the volume is diminishing rapidly. This shows us that there is a RELUCTANCE to take prices higher. There is no appreciable response.If rhere is no response prices cannot go higher in a meaningful way that would encourage us to participate. They go no higher than 12600. There is a ceiling on this action, no amount of banging against this ceiling can encourage participation. Therefore this is weakness, is it not ?
The volume at the bottom of the first red bar at 1815 is not enough to stop the fall dead in its tracks, even at the bottom of this candle, more weakness is anticipated and so after a minor reversal as described prices are now ready to be marked down again. the down bars are more defined, more "destinctive" than the up bars, do you not agree ? They are more we can say "decisive" is the correct way to explain. Now we can begin tio perceive that the market is beginning to "talk" to us, trying to tell us something............
Ah ! Civilians visiting - back in a few minutes........
Right, I'm back. Now do you understand that at this juncture we are changing our posture ;
our intellectual posture from a flat view to a sort of dimensional understanding. At the same time we are working to invoke intuitive input.
This intuitive input "tells us" "makes us aware of""warns us" that the nature of the volume is changing to and fro, from causative to mixing to subjective and this intuitive input which is part of being in it instead of at at it causes us to "KNOW" rather than to guess.
Thereforethis is the is difference between KNOWING in the way that I describe through the route I have shown against fumbling about with mechanical difficulties which is textbook stuff, often tedious and not very well explained.
In this new mental mode we have engaged, everything suddenly goes BOOF ! ,,,,,and becomes much clearer, and the more we work at this clarity the clearer it becomes.
Look at the chart again. At 1755 after a gradual falling offf in the volume the price hits a new low at 112100 precisely, at the bottom of the bottom shadow ot the red candle. For the price to fall so steeply to such an even number and stop dead and reverse shows it is a marker.
If you are tuned you can now perceive that the volume attributable to this red candle started off being causative and finished by being subjective in that the last bit of volume within the timeframe from the bootom of the tail (absolute bottom)to the closeis the consequence of change in price behaviour and NOT the other way round.This is because at that level the price cannot be allowed to fall any further. Its subsequent recovery from the bottom ot the tail to the close is the result of it being lifted. Do you follow closely what i mean ? Good !
Now observe that the marker at 112100 is no accident, it is a significant, (for the chart and timeframe in use) support level. Its clarity is made more obvious later. But the main clue has already been shown. The unravelling of the riddle is through the route I have described above,
which requires the evolvement of a special kind of thinking and a special way of approaching
the problem, with delicate tools ~ not jumbo sized spanners and club hammers, do you follow ? good.
Now we are able to perceive the INTENT more clearly.
112100 is touched 4 times and not penetrated downwards, this means that lower prices are not interesting, to the contrary, it is higher prices that are in the offing.
We now see that prices take off in a northerly direction happily bouncing on their way up, with very little effort required,
because whereas on the bottom , the volume has alternated between being causative and subjective , now it is subjective all the way up. This is obvious.
The volume that appears is not driving the price. Not at all.
It is appearing as a result of the herd now suddenly realising that prices are drifting up, the falls are over, and they are joinng in, creating a cause for the next move.Therefore the appearance of higher prices and the expectation of further improvement is what is attracting the volume and not the other way round. Do you understand this more clearly now? Good ! Excellent !
All these rises and falls are repeated, the move is beginning to gather a life of its own ~ it is too early to say it is gathering momentum, because this will not happen until a trend can be established ~ it is too soon for that, but it is now going up as a controlled rise, and that's OK.,
for most practical purposes of ordinary trading.
That is all.