Mytack volume - way out

blash

Active member
Messages
111
Likes
0
I recently signed up for the MyTrack realtime feed and Sierracharts.

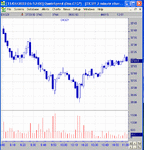
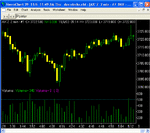
My previous supplier is still working so I am able to compare the different feeds/charts, but there is a large difference in volume reported in a 2min chart.

The Mytrack feed appears to missing out lots of volume on regular occurances.

This is similar to another thread on the innaccuracies of charts but on a larger scale.

Just thought people should know, especially if their using volume in their trading decisions.

The bar at 10:12 in tenfore is showing 1500 but MyTrack/Sierra is showing 433.

Maybe someone could explain the large difference?

Cheers
 

Attachments

  • tendax2.gif
    tendax2.gif
    22 KB · Views: 580
Last edited:
Blash,

Have you thought that maybe Tenfore is wrong ? A good idea would be to get someone with an IB account to also do a comparison using the IB datafeed.


Paul
 
Hi Trader333,

Well the reason for thinking Tenfore are correct is because there is more volume so I'd be surprised if the Tenfore feed was inserting trades, but you never know.

I think its more likely that a feed is going to leave data out to save bandwidth maybe?
 
blash said:
Hi Trader333,

Well the reason for thinking Tenfore are correct is because there is more volume so I'd be surprised if the Tenfore feed was inserting trades, but you never know.

I think its more likely that a feed is going to leave data out to save bandwidth maybe?

CQG reports the same volume as Tenfore, so it is likely this volume is correct.

I cannot attach a screenshot, the board software thinks it is too big.

Regards

Bernd Kuerbs
 
There are always large differences between IB and MT volume data. If you look at either a 1min or a daily chart there are no matches. In general MT volumes are much smaller, the mean is about 40K per day, whereas IB shows about 80K per day, for the DAX.

It's also very noticeable on both ESTX and DAX that there are a lot of zero range bars on the MT plot, particularly in the last hour or so, that don't appear on the IB chart. I only use MT data strictly for backup backfill purposes these days, I'm increasingly doubtful of its quality (certainly for Eurpean indexes, I don't have any knowledge of US ones, it may be better for US stuff)
 
Tenfore is OK. I had Pats JTrader running Ftse Futures alongside Tenfore feed, so I could see the true vol.
It depends how much these companies pay for their source.
 
Just to add to my last post, the IB plot for vol on yesterday's DAX is almost identical to Blash's Tenfore plot (a couple of trivial tiny differences, which are probably just due to small differences in timing).
 
Top