Interesting thread so far. Similar to another poster, I use repeatbale patterns of certain indicators at identifiable areas of potential support/resistance to enter the market (both with and against trend.) The purpose of the repeatable indicator patterns is in provbiding further technical confluence at such a potential supp/res area (they are all potential supp/res areas when price visits them in realtime) in order to enter the market with a high degree of probability when confirmed too by individual price action itself.
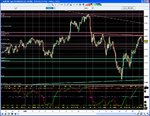
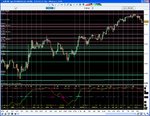
Using a very simplistic example if for example you had identified a resistance level at 0000 and price had arrived there at the same time that say stochastics were in extreme overbought territory, you would probably have more confidence in entering the market than without this knowledge, even if just for a small retrace/pullback trade.
My point is that indicators on their own are probably as useless as some on this thread and other places suggest, but when used as part of an overall tactical approach to your chosen market that may include support/resistance and price action itself, then they have value and can assist in pinpointing the optimum market entry, thereby potentially reducing stop size arequired with the potential effeciency benefits this has.
![1min [trigger] Re-entry type 1.gif](/data/attachments/28/28528-046f366bfbfb0fbb8bc11e8db40da968.jpg?hash=BG82a_v7D7)