Most Indicators are useless - why does anyone bother with them?

Thanks for the post db, I think its a good one anyway

*I've added a couple of charts that may help clarify. OTOH, I don't want to hijack this thread. So if one of the mods wants to delete all this, that's fine. There's really nothing new here anyway.

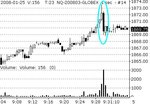
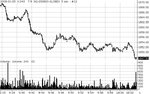
The first chart is a CVB chart (Constant Volume Bar). It provides the context (or at least some of it; this illustrates a few days; the relevant S/R zone on the NDX chart posted earlier represents six months; six months trumps a few days). Clearly there is a lot of sludge to work through if one wants to get past 1920. And then there's another layer up to 2000. As for "short-term" R, one can draw a line through the middle of all this, but I find this distracting more often than not, and it can set up an anticipatory mindset that prevents one from focusing on the volume activity as it is as opposed to what it might be or will be or could be or whatever.

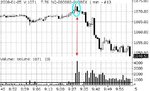
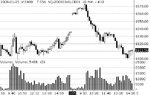
The second chart is a one-second chart of the open. This may be a more graphic illustration of the "hot iron" comment I made above.

db

Thanks for asking the question FW

Very good post IMO

I missed 2 very good trades this weak because I waited for 3 min bars to print, no confidence I guess in pre-market assesment, waited for confirmation (time interval) well not no confidence, poor method entry = wait :eek: GONE :mad:

The bar ended up 59 pts wide (ftse) its nose was on the tick of R, with a gap under.

It was a HOT IRON for sure.

Normal market conditions would not have shown me the error of my ways I would have popped my stop over the bar (15 pts max) and watched a reasonable speed rejection in my comfort zone speed, what I am used to.

Time intervals, I tend to tick them off as I pass, errrrrrrrrr like stations on a good trade entry.

Not really given it any thought for ages but your post and missed trades this week as drawn my attention to what I myself was comeing to think was poor entry method.

In my early days, ha still early days I would catch myself entering at the level intended and give myself a good telling off for jumping the gun or my setup

They were nearly all good trades = the best, and the ones that failed, failed quick so I was still out for dinner and down the beach anyway :p

Question please db

I declined the entry later lower down springboard (ftse was exactly the same)

I switched to scalper setting instead having missed the move (59 pts Stop to expensive for me):whistling

How do you manage the risk of entry lower down without a very large stop, or is that me being daft, I would if I entered lower down find it hard to say I am wrong untill the area of rejection falls, ie Hard STOP over R even then another rejection very possible

Do you then base entry on lower level price action and errrrrrrrrrrr dance a couple of entries with tight stops or something different :?:

sorry thread topic :cheesy:

Indicators are useless,

I would draw your attention to the word indicate, they work and they dont work, once you have used them and no where they do not work and do work, you do not need them anymore IMO you just see it on the chart


Oh look rsi bul div and price failing to take any notice (no rsi on chart) aaa ha perhaps we are in a bear, better check

(Bulls a Bear & Bears a Bull) :confused: = dont take it at face value/ filter higher timeframe trend or not/ market condition etc :?:
 
How do you manage the risk of entry lower down without a very large stop, or is that me being daft, I would if I entered lower down find it hard to say I am wrong untill the area of rejection falls, ie Hard STOP over R even then another rejection very possible

Most often, this question translates not as "how do you manage the risk" but as "how do you manage the fear". But in both cases, the answer is the same: you have to know what you're looking for and you have to know what you're looking at. The trader who doesn't know what he's looking for or what he's looking at is going to be crippled with fear, and he will eventually fail.

The dynamics of real-time charts are generally missed by those who use static charts, much less hindsight charts. This is one reason why people dismiss hindsight charts: they don't know what they're looking at. Here, for example, is a repeat of the 1m chart I posted earlier:

attachment.php

There seems to be nothing particularly remarkable about the circled bars. However, when one plots this using a 1s interval (again using the chart I posted earlier), the circled bar appears to be considerably more urgent:

attachment.php

But to go through an entire day like this would take a great many charts, and the point of it would be quickly lost through sensory overload. Therefore, anyone who has no experience with dynamic real-time charts, i.e., charts that move, but concentrates instead on static "snapshot" charts will likely not be "ready" to understand what's happening in the charts posted here.

This is the same as the 1m chart above with a few additional bars after the breakdown. The springboard is circled:

attachment.php

Note how the springboard looks on a 5m chart:

attachment.php

Note that on a 10m chart, it does not appear at all, even though it's still "there":

attachment.php

Now, how do I manage the fear?

Here is a 5s chart of the open. Note that price plunges to 1862, but there's no follow-through. There is then a rally. Does this frighten me? No, (1) because my stop is above all this and (2) volume dissipates as price rises. Price then resumes its decline and levels off around 57/58 at around 0942. If one looks at 50 as an important level that's likely to be tested, this leveling constitutes another springboard, i.e., a preparation for a further decline. This decline occurs and price hits 50, or close to. Price rallies back to the springboard level at 57/58, but then volume dries up. There's no follow-through. Instead, it falls back to 50. It hammers away at 50 again and again, rallying to 54 three times but never breaking through. How do I know it's going to break through 50? Because of the volume, which is heavier on the downside and evaporates on the upside. Can one see this in a static chart? Only generally, and perhaps not even then. In a real-time moving chart, however, what's happening with volume and its relationship to price is very clear.

attachment.php

Of course, not everyone can look at RT charts. They can only pop in every few hours. If they're going to take this trade at all, they may have to resort to some line crossing some other line or some bar touching or recoiling off some band or other. But they're not going to take the trade because they understand what traders are doing. They're going to take it because some line is crossing some other line or whatever. And for this reason, they will never truly conquer their fear.

And what if it all goes wrong? What if selling suddenly dries up and buyers push price back through the springboard and out the other side? I'll see and understand what's happening by monitoring the volume (cause) and its effect on price. I'll be out by 52 +/- and ready to go long at 55 +/-. If buyers lose their juice and the springboard becomes instead an equilibrium level, then I exit and stand aside, waiting to see who gains the upper hand.
.
.
.
 

Attachments

  • Image2.jpg
    Image2.jpg
    63.2 KB · Views: 2,653
  • Image3.jpg
    Image3.jpg
    45.2 KB · Views: 2,588
  • Image1.jpg
    Image1.jpg
    73.5 KB · Views: 2,560
  • Image6.jpg
    Image6.jpg
    60.9 KB · Views: 2,540
  • Image7.jpg
    Image7.jpg
    62 KB · Views: 2,558
  • Image5.jpg
    Image5.jpg
    101.9 KB · Views: 2,561
Last edited:
[/CENTER]
Of course, not everyone can look at RT charts. They can only pop in every few hours. If they're going to take this trade at all, they may have to resort to some line crossing some other line or some bar touching or recoiling off some band or other. But they're not going to take the trade because they understand what traders are doing. They're going to take it because some line is crossing some other line or whatever. And for this reason, they will never truly conquer their fear.

And what if it all goes wrong? What if selling suddenly dries up and buyers push price back through the springboard and out the other side? I'll see and understand what's happening by monitoring the volume (cause) and its effect on price. I'll be out by 52 +/- and ready to go long at 55 +/-. If buyers lose their juice and the springboard becomes instead an equilibrium level, then I exit and stand aside, waiting to see who gains the upper hand.


What you seem to be pointing out is that only professional traders, who can afford to dedicate their whole working day to the market of their choice, are the ones who are fearless.

It's not a question of conquering fear. Any fool can be fearless and still lose his money. In fact, I would say that fear is one of the most basic of animal instincts and is the prime one of self survival.

Most traders are part time. It is true that the saying is that most traders fail. Is the former point , if true, the reason for the latter? Personally, I don't think so.

I would say to all traders, never be eager to become fearless. You will remove one of your most useful defenses.

I have been trading and investing for the last 40 years, at least. I'm worried about the market, today, as much as I was in previous crisis,and I am still trading this market at 76 years of age, with the same feeling that a soldier has when crossing a minefield.

Split
 
Being fearless is not the same as being reckless. And there's a big difference between respecting the market and being afraid of it. If you're still fearful after 40 years of trading, that's unfortunate.
 
WOW, very impressed db

Most often, this question translates not as "how do you manage the risk" but as "how do you manage the fear". But in both cases, the answer is the same: you have to know what you're looking for and you have to know what you're looking at. The trader who doesn't know what he's looking for or what he's looking at is going to be crippled with fear, and he will eventually fail.

The dynamics of real-time charts are generally missed by those who use static charts, much less hindsight charts. This is one reason why people dismiss hindsight charts: they don't know what they're looking at. Here, for example, is a repeat of the 1m chart I posted earlier:

attachment.php

There seems to be nothing particularly remarkable about the circled bars. However, when one plots this using a 1s interval (again using the chart I posted earlier), the circled bar appears to be considerably more urgent:

attachment.php

But to go through an entire day like this would take a great many charts, and the point of it would be quickly lost through sensory overload. Therefore, anyone who has no experience with dynamic real-time charts, i.e., charts that move, but concentrates instead on static "snapshot" charts will likely not be "ready" to understand what's happening in the charts posted here.

This is the same as the 1m chart above with a few additional bars after the breakdown. The springboard is circled:

attachment.php

Note how the springboard looks on a 5m chart:

attachment.php

Note that on a 10m chart, it does not appear at all, even though it's still "there":

attachment.php

Now, how do I manage the fear?

Here is a 5s chart of the open. Note that price plunges to 1862, but there's no follow-through. There is then a rally. Does this frighten me? No, (1) because my stop is above all this and (2) volume dissipates as price rises. Price then resumes its decline and levels off around 57/58 at around 0942. If one looks at 50 as an important level that's likely to be tested, this leveling constitutes another springboard, i.e., a preparation for a further decline. This decline occurs and price hits 50, or close to. Price rallies back to the springboard level at 57/58, but then volume dries up. There's no follow-through. Instead, it falls back to 50. It hammers away at 50 again and again, rallying to 54 three times but never breaking through. How do I know it's going to break through 50? Because of the volume, which is heavier on the downside and evaporates on the upside. Can one see this in a static chart? Only generally, and perhaps not even then. In a real-time moving chart, however, what's happening with volume and its relationship to price is very clear.

attachment.php

Of course, not everyone can look at RT charts. They can only pop in every few hours. If they're going to take this trade at all, they may have to resort to some line crossing some other line or some bar touching or recoiling off some band or other. But they're not going to take the trade because they understand what traders are doing. They're going to take it because some line is crossing some other line or whatever. And for this reason, they will never truly conquer their fear.

And what if it all goes wrong? What if selling suddenly dries up and buyers push price back through the springboard and out the other side? I'll see and understand what's happening by monitoring the volume (cause) and its effect on price. I'll be out by 52 +/- and ready to go long at 55 +/-. If buyers lose their juice and the springboard becomes instead an equilibrium level, then I exit and stand aside, waiting to see who gains the upper hand.
.
.
.

Hi db

Thats a post (y)

I am enlightened, I have been lurking on VSA thread and others etc but that is the business db it really is IMO

All the locations etc are well known to me, but I somehow feel I am going to get to no them a little better

Thanks for direction

Fear, I agree 100% infact 200%,

moved to DA 1 month before crimbo, up till then 100% confident in what I was doing

paper traded and got well bored (not done it for some time) shame on me for taking it light

After Crimbo straight in, no real problems but an instinct informing me from deep within that all is not well and as it should be:confused: :cry:

Watching the hour bars form/ my usual entries / exits etc come and go with the volume & order book (not experienced yet) in view:eek:

thought it might be a case of early door nerves so kept it small and kept going and doing ok, very considering 1st month, but I did not move to the real market to scalp I came to trade proper with control and no what I was looking at was exact and real.

Its more then that:idea:

FEAR, lack of confidence had returned, I had auto returned to scalping method of early days.:-0

I was getting there myself but your post having watched the last 2 months contracts and volume wizz past is

Very very good


:smart: asssssssssssssss ok ok you can teach me something db, but hey, Im the PinkPig now, and look I have sprouted some wings:eek:

Better stay on the ground for a bit till I get the hang of them:eek: in these market conditions I think.

Only Split as received this one, sorry Split but this one is even better, not better errrrrrrrrrrrrrrrr I make it a dead heat :p

Thank you for taking me by the ears and instructing me to my face db

appreciated :D
 
good advice

What you seem to be pointing out is that only professional traders, who can afford to dedicate their whole working day to the market of their choice, are the ones who are fearless.

It's not a question of conquering fear. Any fool can be fearless and still lose his money. In fact, I would say that fear is one of the most basic of animal instincts and is the prime one of self survival.

Most traders are part time. It is true that the saying is that most traders fail. Is the former point , if true, the reason for the latter? Personally, I don't think so.

I would say to all traders, never be eager to become fearless. You will remove one of your most useful defenses.

I have been trading and investing for the last 40 years, at least. I'm worried about the market, today, as much as I was in previous crisis,and I am still trading this market at 76 years of age, with the same feeling that a soldier has when crossing a minefield.

Split

Hi Split

Nice to see you, hope we are on talking terms :?:

Good post

always confuses me why would be traders want to remove all emotion

Its who we are, we have to control them and learn what they are trying to tell us and ...

the more you do something (learning) the better your inner instinct becomes IMO

You can act with authority in what to others looks a fearless or reckless way, but if you are accomplished and fully competent and .......

HUMBLE (you may be wrong) Hard STOP and downside considered

Thats how you learn something and push and learn a bit more

A pro trader as reached a level of ability that allows him or her to pay their way in the world by trading alone. Does not mean they have to stop learning, does not mean they need to learn more, up to the trader. Small business does not need to grow into a multi national does it :?:

Nice to see you Split, good trading next week:clover: if you feel fearless :LOL:

all the best to LM, hows he doing, = not heard from him = I pm"d him= no joy :(
 
No hurry. How does one get to Carnegie Hall?


:confused:

I don"t ......

use a map:?: check the.................................


:LOL::LOL::LOL:

very good I will down load it again db

along the quiet bit down near the river after I have done all that and a bit more.

FW can jump around in the mountain pass"s, I hate drawdown
 
Being fearless is not the same as being reckless. And there's a big difference between respecting the market and being afraid of it. If you're still fearful after 40 years of trading, that's unfortunate.

I don't consider myself unfortunate. In fact, the opposite. That's why I'm, probably, still around and, who knows? It may be the secret of longevity. :D

I admit that recklessness is unfortunate. Fear is a part of one's armament.
 
Of course, not everyone can look at RT charts. They can only pop in every few hours. If they're going to take this trade at all, they may have to resort to some line crossing some other line or some bar touching or recoiling off some band or other. But they're not going to take the trade because they understand what traders are doing. They're going to take it because some line is crossing some other line or whatever. And for this reason, they will never truly conquer their fear.

To quote a previous post of yours, especially the first two sentences.

As I said, before, only those able to watch charts all day or, at least all the time that they have a trade open, can find any use for RT charts. These must be professional people. I suggest that even those, feel a touch of apprehension. unease, call it what you will except, God forbid, fear, that they may be about to lose more than they want.

This is not intended to detract from your charts, more on your comments about fear. I believe that fear gives a signal that all may not be 100%. A good signal to get, in my experience.
 
As for those who have a use for RT charts, one needn't have to watch charts all day or be a "professional". Anyone with access to replay can watch charts unfold in "real time" whenever he likes. I can't think of a better and faster way of grasping the relstionship between price and volume. Even an EOD trader who is able to watch his trade "move" at up to 5000 times normal speed may learn enough of what's happening "underneath" to enable him to manage his trade unemotionally.
 
As for those who have a use for RT charts, one needn't have to watch charts all day or be a "professional". Anyone with access to replay can watch charts unfold in "real time" whenever he likes. I can't think of a better and faster way of grasping the relstionship between price and volume. Even an EOD trader who is able to watch his trade "move" at up to 5000 times normal speed may learn enough of what's happening "underneath" to enable him to manage his trade unemotionally.

db

more good advice

To much for one day. I FEAR I have to much work to do

wondered what I was going to use that function for, looks like I will have to ask FW if I can make live calls a bit later :LOL: next day ok FW :whistling
 
Last edited:
I'm not making fun, I'm serious here

As Obi Wan said:

Use the force, Luke. Let go, Luke. Luke, trust me.
 
Db
Quote "Most often, this question translates not as "how do you manage the risk" but as "how do you manage the fear". But in both cases, the answer is the same: you have to know what you're looking for and you have to know what you're looking at. The trader who doesn't know what he's looking for or what he's looking at is going to be crippled with fear, and he will eventually fail." Quote

Excellent chart illustrations and a great quote, that is what I went through when I relied only on maths. based indicators or some patterns , now that I have grasped some of the principles of price/volume relationships I am better able to handle fear of pulling the trigger, or missing any moves etc.
Your comments and charts as always are highly informative, please keep them coming.
 
Db

now that I have grasped some of the principles of price/volume relationships I am better able to handle fear of pulling the trigger, or missing any moves etc.

Well I have absolutely no fear of pulling the trigger, and I sit and watch squiggly lines all day for a living!!! I see the same boring patterns every day, it really isn't that hard to gain confidence when you see them so often.
 
I see the same boring patterns every day, it really isn't that hard to gain confidence when you see them so often.

I hope some new traders are listening! That's exactly the point of it all. Trading is about pattern recognition. The only way anyone really gets competent is by practicing over and over and over and over.....

Unfortunately, most new traders never spend enough time practicing. They bounce all over the place. I know I certainly did.
 
Top