You are using an out of date browser. It may not display this or other websites correctly.
You should upgrade or use an alternative browser.
You should upgrade or use an alternative browser.
Most Indicators are useless - why does anyone bother with them?
bluetipex
Active member
- Messages
- 174
- Likes
- 22
Out of interest, a question for those of you who use indicators:
How do you determine when to NOT trade from indicators? For example, on the Dax today you should have stayed FLAT for most of the day. I only know of 2 indicators that kept me out today.
Second question for those that DO NOT use indicators, how do you determine to stay out of choppy/sideways markets like today? Is it as simple as drawing 2 horizontal lines above and below the sideways action and simply trading a significant break above or below these lines?
dbphoenix
Guest Author
- Messages
- 6,954
- Likes
- 1,266
Out of interest, a question for those of you who use indicators:
How do you determine when to NOT trade from indicators? For example, on the Dax today you should have stayed FLAT for most of the day. I only know of 2 indicators that kept me out today.
Second question for those that DO NOT use indicators, how do you determine to stay out of choppy/sideways markets like today? Is it as simple as drawing 2 horizontal lines above and below the sideways action and simply trading a significant break above or below these lines?
As a member of the party of the second part, I can't speak to the DAX as I don't maintain a chart of it. But I didn't stay out of the NQ today. I entered shortly after the open and stayed in until I got a reversal signal at support. If the DAX was similar today, perhaps you could post a 1m chart.
wasp
Legendary member
- Messages
- 5,107
- Likes
- 880
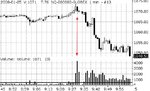
Not sure if this data is correct as its on metatrader and I don't watch indicies but looks fine to me, plenty of opportunities........
Short the breakout and trail behind resistance and support when broken....
edit: r=r on the upper line not s=r, sorry!
Short the breakout and trail behind resistance and support when broken....
edit: r=r on the upper line not s=r, sorry!
Attachments
Last edited:
Atilla
Legendary member
- Messages
- 21,114
- Likes
- 4,304
In fact, I'm through with price, we are going our seperate way...see chart below:
Is that heads or tails? :cheesy:
bluetipex
Active member
- Messages
- 174
- Likes
- 22
As a member of the party of the second part, I can't speak to the DAX as I don't maintain a chart of it. But I didn't stay out of the NQ today. I entered shortly after the open and stayed in until I got a reversal signal at support. If the DAX was similar today, perhaps you could post a 1m chart.
Sorry, I assume you trade the NQ from the US open at 2.30pm UK time? The Dax is open from 7am UK time, and my indicators said "keep out" from about 10.15am to 3.15pm UK time. At 3.20pm I finally had a short signal. However, I got fed up watching and called it a day at 2pm. So I missed a lovely move worth over 100 points. Oh well.
I also trade the YM, which went short at the same time, and I assume the NQ and ES did pretty much the same thing.
I'm going to quickly search the forum and find out how to post charts, I'm sure it can't be that hard....
dbphoenix
Guest Author
- Messages
- 6,954
- Likes
- 1,266
Perhaps what you ought to do is sleep late and trader later . . . 🙂
But I may be able to save you some time, particularly since all of this depends on support and resistance.
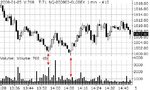
I posted the following a few days ago. The S/R zone of interest is 1750 to 1850, with a secondary S level at 1800.

Note on the first chart that there is a clear rejection of the opening price, which is 25pts outside the S/R zone.
Note on the second that the volume on the test of S at 14:09 is considerably less than the volume when price hits S the first time.
But I may be able to save you some time, particularly since all of this depends on support and resistance.
I posted the following a few days ago. The S/R zone of interest is 1750 to 1850, with a secondary S level at 1800.
Note on the first chart that there is a clear rejection of the opening price, which is 25pts outside the S/R zone.
Note on the second that the volume on the test of S at 14:09 is considerably less than the volume when price hits S the first time.
Attachments
Last edited:
tune
Well-known member
- Messages
- 394
- Likes
- 51
Perhaps what you ought to do is sleep late and trader later . . . 🙂
🙂
bluetipex
Active member
- Messages
- 174
- Likes
- 22
Perhaps what you ought to do is sleep late and trader later . . . 🙂
But I may be able to save you some time, particularly since all of this depends on support and resistance.
I posted the following a few days ago. The S/R zone of interest is 1750 to 1850, with a secondary S level at 1800.
Note on the first chart that there is a clear rejection of the opening price, which is 25pts outside the S/R zone.
Note on the second that the volume on the test of S at 14:09 is considerably less than the volume when price hits S the first time.
All looks good, but how do you know when the S/R lines will hold and when they will be breached? This is so different to how I look at charts!! I look at your chart and think to myself, "where do I enter a trade in real time?" Just goes to show there's more than 1 way of skinning a cat! For me to use this method I'd probably have to "unlearn" what I've taught myself over the years and start afresh. I put volume on my charts years ago, but I gleaned nothing from it, as I wasn't taught how to interpret it with price. Therefore I removed it and never put it back.
The argument in this thread is a bit like looking at a complex solid object in 3 dimensions: some looking at the object will see a particular point-of-view. Others looking at the same object from a different point in space will have an entirely different point-of-view. Each convinced that their point-of-view is correct, when looking at the same object. What you need is the ability to see multiple points-of-view! Actually, this analogy could be applied to many of society's modern problems.
I think your method is awesome, and I'd love to spend 4-5 years learning it. My trading would obviously improve as a result. I'm not arrogant enough to think that I have anywhere near the holy grail, but my method works for me. I just realised my charts look like a maze of squiggly lines, (so I better not post one) but to me they make perfect sense, because I've been watching them, day in, day out, all day, for years!!! And more importantly, you need to know how they act in REAL TIME, looking at charts in hindsight has limited value IMHO.
firewalker99
Legendary member
- Messages
- 6,655
- Likes
- 613
The Dax is open from 7am UK time, and my indicators said "keep out" from about 10.15am to 3.15pm UK time. At 3.20pm I finally had a short signal. However, I got fed up watching and called it a day at 2pm. So I missed a lovely move worth over 100 points. Oh well.
Hi bluetipex, I used to be one of those people who enjoyed the DAX because it was open for 14 hours straight. Unfortunately I came to the conclusion that it only meant sitting behind the screen more whilst doing nothing and ultimately getting frustrated and putting on a trade which wasn't according to the plan. So I've decided that there are so many other interesting things you can do, and that I really only needed 1 or 2 trades to call it a day. Anything more was probably just scalping or squeezing something out of the market which isn't there. Besides, most of the time the major moves come early morning, or around the US open. This isn't to say that the DAX can't a good market to trade, but perhaps you could just focus on those timeframes where a move is more likely to happen.
I'm going to quickly search the forum and find out how to post charts, I'm sure it can't be that hard....
Just scroll down when you reply to a message, click "manage attachments", click Browse next, and select the file you wish to upload from the pop-up window which shows a mini file browser.
firewalker99
Legendary member
- Messages
- 6,655
- Likes
- 613
I entered shortly after the open and stayed in until I got a reversal signal at support.
Note on the first chart that there is a clear rejection of the opening price, which is 25pts outside the S/R zone.
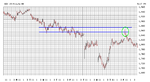
Incidentally, I think I just might have taken the exact same short for different reasons... You mentioned a clear rejection of the opening price based on that high volume, but without any other point of reference than those 25 points off from the major S/R area, how can you know that the peak in volume isn't just occuring because the market just opened?
I've attached a chart (premarket trading isn't on it) of how I see things, and why I think a short there was valid. Any comments would be appreciated (although I'm not sure if this thread is still the right place for it).
If you say reversal signal, I'm guessing you will reverse instead of just exit your short position? Despite that reversal signal, price still closed lower in the last 15 minutes of trading. This is why I don't like trading near the close, I've experienced this several times, but it seems as if signals near the EOD aren't so reliable as signals earlier in the day. And if you're wrong, there's not much you can do about it anymore neither...
It seems hard to reconcile S/R zones on such a big time frame with 1-minute charts. As you say, the zone of interest, is as wide as 50 points, so you'd need either very wide stops or you need to find some minor S/R zones in the meantime...I posted the following a few days ago. The S/R zone of interest is 1750 to 1850, with a secondary S level at 1800.
Note on the second that the volume on the test of S at 14:09 is considerably less than the volume when price hits S the first time.
Would you consider that enough confirmation to warrant a long entry? I would definitely consider it an exit signal, but given that the trend is still down, it seems like going against a flow somehow.
Attachments
Rhody Trader
Senior member
- Messages
- 2,620
- Likes
- 266
Out of interest, a question for those of you who use indicators:
How do you determine when to NOT trade from indicators? For example, on the Dax today you should have stayed FLAT for most of the day. I only know of 2 indicators that kept me out today.
Second question for those that DO NOT use indicators, how do you determine to stay out of choppy/sideways markets like today? Is it as simple as drawing 2 horizontal lines above and below the sideways action and simply trading a significant break above or below these lines?
Like DB, I fall generally into the second group. I do have to use indicators in the market analysis I actually write professionally, as we have a proprietary indicator we use extensively in our commentary. I also use some statistical methods for filtering and screening to identify potential trades, but my actual trading is 100% based on the price action.
With that in mind the thing, as an answer to your questions in a way that can address both approaches, it's definitely worth looking at what is going on around your primary market to see if anything interesting is likely to happen. Obviously, if you're a short-term trader, being aware of the earnings, ecnomic data, and speaker calendar can be important. But so too is looking at what's happening in interest rates, forex, and commodities. And of course, if you're trading in one stock market, it's worth looking at what's going on in others. Markets aren't often volatile in isolation.
I'm not saying to need to look to the EUR exchange rate to trade the DAX, but if there's been a lot of volatility or no volatility in that market overnight, that provides you one clue as to what you may see in stocks.
dbphoenix
Guest Author
- Messages
- 6,954
- Likes
- 1,266
All looks good, but how do you know when the S/R lines will hold and when they will be breached?
Volume. And if you're wrong, you have your stop.
I think your method is awesome, and I'd love to spend 4-5 years learning it.
I doubt it would take more than a few weeks, if that, depending on how willing the student is to leave his previous preconceptions -- such as indicators -- behind. The principles are simple if one knows what an auction is.
And more importantly, you need to know how they act in REAL TIME,
True. That's why it's essential to learn the principles.
looking at charts in hindsight has limited value IMHO.
Hindsight charts are the only way to illustrate principles, though replay is much preferable to a static chart. If you're interested, find someone who knows this and get him to sit down with you with some replay charts. I doubt it will take long for you to get it. Absent that, take a look at VSATrader's threads (e.g., http://www.trade2win.com/boards/price-volume/27069-s-p-analysis-friday-2nd-oct.html).
. . .
Last edited:
dbphoenix
Guest Author
- Messages
- 6,954
- Likes
- 1,266
Incidentally, I think I just might have taken the exact same short for different reasons... You mentioned a clear rejection of the opening price based on that high volume, but without any other point of reference than those 25 points off from the major S/R area, how can you know that the peak in volume isn't just occuring because the market just opened?
What difference does it make? Price is at R, there's a surge in volume, price falls*. If that's not enough, there's a springboard at 1850 a few minutes later, and one can short that. If he's not confident in the short, he can bracket. Of course, if he hasn't thought about any of this before the open and/or doesn't know what to look for (which is one of the functions of hindsight charts), then he'll probably just sit there and do nothing.
I've attached a chart (premarket trading isn't on it) of how I see things, and why I think a short there was valid. Any comments would be appreciated (although I'm not sure if this thread is still the right place for it).
It's essentially the same zone that I was looking at. What matters is how traders react when price reaches or enters that zone. Given the volume and the effect on price, reaching that zone was like touching a hot iron.
If you say reversal signal, I'm guessing you will reverse instead of just exit your short position?
Depends. I like to be out by lunch, so I'll likely just exit and quit.
Despite that reversal signal, price still closed lower in the last 15 minutes of trading.
True, but I stopped caring about that sort of thing long ago. There are other things I'd rather do that sit there for three or four hours waiting for the possibility. More likely, I'd find something that wasn't there and take a losing trade.
It seems hard to reconcile S/R zones on such a big time frame with 1-minute charts. As you say, the zone of interest, is as wide as 50 points, so you'd need either very wide stops or you need to find some minor S/R zones in the meantime...
What matters is the point at which price hits R and what happens there. It makes no sense to me to use an hourly chart or whatever and wait up to an hour to see what happens. If traders are reacting to R, why wait? Waiting requires a much wider stop.
Those who perseverate on bar intervals are likely using price bars as indicators, just as many people use candlesticks as indicators. The bar interval is irrelevant. What matters is the movement of price. Any bar interval beyond a tick is a summary. What sense is there is in waiting for, say, a 5m bar to "close", much less 10 or 15 or 30? Are professional traders 'round the world waiting to act according to what price does in five minutes, or are they acting on what price is doing right now?
Would you consider that enough confirmation to warrant a long entry? I would definitely consider it an exit signal, but given that the trend is still down, it seems like going against a flow somehow.
Like I said, it depends on when. If it's much after 11:00, I don't care. However, I couldn't see MSFT's earnings and the useless economic package as sufficient reason to head back to R. That didn't mean it couldn't or wouldn't. But if I'm done, I don't have to worry about it.
Keep in mind that I don't look for 30 trades a day. Nor am I determined to trade every day. If price had not been where it was, I probably would not have traded at all. I wait for the right trade and I take it. If it's not there, I don't try to manufacture something. That's kid stuff.
*I've added a couple of charts that may help clarify. OTOH, I don't want to hijack this thread. So if one of the mods wants to delete all this, that's fine. There's really nothing new here anyway.
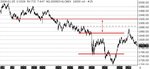
The first chart is a CVB chart (Constant Volume Bar). It provides the context (or at least some of it; this illustrates a few days; the relevant S/R zone on the NDX chart posted earlier represents six months; six months trumps a few days). Clearly there is a lot of sludge to work through if one wants to get past 1920. And then there's another layer up to 2000. As for "short-term" R, one can draw a line through the middle of all this, but I find this distracting more often than not, and it can set up an anticipatory mindset that prevents one from focusing on the volume activity as it is as opposed to what it might be or will be or could be or whatever.
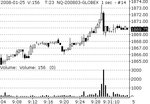
The second chart is a one-second chart of the open. This may be a more graphic illustration of the "hot iron" comment I made above.
Attachments
Last edited:
The problem with indicators is that different time frames tell a different story. for eg: if price reaches major resistance (on daily/weekly chart) price of 1000 for eg, then on the 5 min chart maybe you see a nice bearish divergence with stoch/MACD/RSI, but the 15 min chart is still showing strong upward momentum!
But I suppose this problem exists in technical analysis as a whole even with just reading price charts: different time frames tell a different story.
But I suppose this problem exists in technical analysis as a whole even with just reading price charts: different time frames tell a different story.
Rhody Trader
Senior member
- Messages
- 2,620
- Likes
- 266
The problem with indicators is that different time frames tell a different story. for eg: if price reaches major resistance (on daily/weekly chart) price of 1000 for eg, then on the 5 min chart maybe you see a nice bearish divergence with stoch/MACD/RSI, but the 15 min chart is still showing strong upward momentum!
But I suppose this problem exists in technical analysis as a whole even with just reading price charts: different time frames tell a different story.
Exactly. That's why you need to focus on the intended timeframe of your trade.
Exactly. That's why you need to focus on the intended timeframe of your trade.
Well the problem is what to do when they contradict each other , as is the case most often.
Trader333
Moderator
- Messages
- 8,766
- Likes
- 1,030
The problem with indicators is that different time frames tell a different story. for eg: if price reaches major resistance (on daily/weekly chart) price of 1000 for eg, then on the 5 min chart maybe you see a nice bearish divergence with stoch/MACD/RSI, but the 15 min chart is still showing strong upward momentum!
Not a problem in my view, just use MTF analysis and when all TF align take the trade.
Paul
Not a problem in my view, just use MTF analysis and when all TF align take the trade.
Paul
Well in long term stock trading thats fine. I look at daily and weekly charts and go with the trend. but in fx and futures where my trades can last from 30 mins to a few days, that where i have a problem. for eg sometimes if the 15 min chart shows reversal, to go with daily chart trend, I find that the 60 min (or 240 min) are contradicting.
Anyway the problem I have is not restricted to indicators alone (subject of thread) but technical analysis as a whole
dbphoenix
Guest Author
- Messages
- 6,954
- Likes
- 1,266
Well in long term stock trading thats fine. I look at daily and weekly charts and go with the trend. but in fx and futures where my trades can last from 30 mins to a few days, that where i have a problem. for eg sometimes if the 15 min chart shows reversal, to go with daily chart trend, I find that the 60 min (or 240 min) are contradicting.
Anyway the problem I have is not restricted to indicators alone (subject of thread) but technical analysis as a whole
Whether one TF "contradicts" another or not has less to do with price action and more with the choices one makes in displaying it. Consider that there are no contradictions among TFs, that price simply moves from one area to another. If you trade, for example, support and resistance, then questions of "trend" become largely irrelevant. If you attempt to trade trend without regard to support and resistance, then, as John said, focus on your chosen interval and ignore everything else.
Similar threads
- Replies
- 17
- Views
- 4K
- Replies
- 18
- Views
- 8K
- Replies
- 9
- Views
- 4K