isatrader
Senior member
- Messages
- 2,965
- Likes
- 136
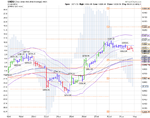
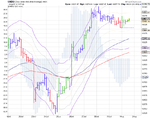
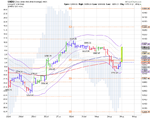
I started forward testing a simple rules based momentum method on the Dow 30 Index yesterday and thought it would be useful to start a new journal so that I have a visual aid showing each trade as well as my excel spreadsheet that I always keep. I've been manually back-testing it for a while and the results show some potential, although I've still got another year of 60 minute charts to go through to get it up to date.
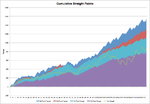
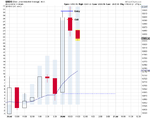
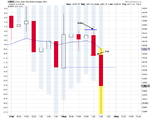
I've been experimenting in excel with different target sizes, such as 30, 20, 15 and 10 points above entry with a 30 point stop loss, and although all are profitable on paper with the 30 point target making the most, the volatility is also greater and win/loss rate improves considerably with the smaller targets. For example, a 30 point target has a 62.89% win rate, whereas the 10 point has an 83.02% win rate. So I've gone with the 15 point target for my forward test, which has a 77.99% win rate from my small sample of trades on the back test, as I know some of that will be eroded through spread, slippage, and my entries occasionally being too slow when the market's moving strongly. Also my manual testing has been done using the index data on stockcharts, so there will be differences with my CFD brokers charts as well which could further erode any edge the method might have. But that's what the forward testing is for.
Attached is the back test graph results, showing the differences between the various target sizes. The graph is a years worth of trades between Nov10 and Oct11, but it only totals 159 trades so it is a very small sample and as such the accuracy of the results is likely very low.
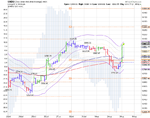