Momentum Trades

isatrader

Senior member
Messages
2,963
Likes
135
I started forward testing a simple rules based momentum method on the Dow 30 Index yesterday and thought it would be useful to start a new journal so that I have a visual aid showing each trade as well as my excel spreadsheet that I always keep. I've been manually back-testing it for a while and the results show some potential, although I've still got another year of 60 minute charts to go through to get it up to date.

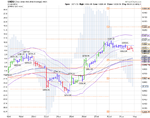
I've been experimenting in excel with different target sizes, such as 30, 20, 15 and 10 points above entry with a 30 point stop loss, and although all are profitable on paper with the 30 point target making the most, the volatility is also greater and win/loss rate improves considerably with the smaller targets. For example, a 30 point target has a 62.89% win rate, whereas the 10 point has an 83.02% win rate. So I've gone with the 15 point target for my forward test, which has a 77.99% win rate from my small sample of trades on the back test, as I know some of that will be eroded through spread, slippage, and my entries occasionally being too slow when the market's moving strongly. Also my manual testing has been done using the index data on stockcharts, so there will be differences with my CFD brokers charts as well which could further erode any edge the method might have. But that's what the forward testing is for.

Attached is the back test graph results, showing the differences between the various target sizes. The graph is a years worth of trades between Nov10 and Oct11, but it only totals 159 trades so it is a very small sample and as such the accuracy of the results is likely very low.
 

Attachments

  • cumulative-points_backtest.png
    cumulative-points_backtest.png
    23 KB · Views: 406
Trade 1

Date: 25/7/12

DOW 30

Entry: 12678.9
Exit: 12694

Profit/Loss: +15.1

Highest high during trade: 12732.4
Low during trade: 12672.2
Max above Entry: 53.5
Max below Entry: -6.7

Entry Bar Time (US): 1.02pm
Exit Bar Time (US): 1.23pm
Total Trade length: 21 mins

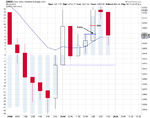
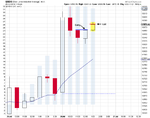
The momentum turned positive on the 11am ET hourly bar, so I place my buy stop entry 0.1 pt above the high of the bar. This wasn't filled during the 12pm bar and it made a slightly lower high, but the momentum stayed positive, so I moved my buy stop 0.1 pt above the 12pm bar high and this was filled at 1.02pm ET. I adjusted my target to 15 pts above the entry price, which had slipped a little by 0.3 pts and then went out for a while. When I came home the target had been hit and the price had moved over 50 pts above the entry level and started to come back down. So a pleasing first trade.

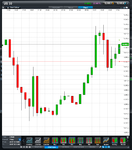
Attached is the 60 minute charts I'm using to trade off of, including the CFD chart just after the entry which shows the actual entry point and the stop and target. It's clear there are differences, but how much it affects the results of the trades will become clearer in time.
 

Attachments

  • INDU-60min_25-7-12.png
    INDU-60min_25-7-12.png
    11.8 KB · Views: 318
  • INDU-60min_CFD_25-7-12.png
    INDU-60min_CFD_25-7-12.png
    54.5 KB · Views: 363
  • INDU-60min_m_25-7-12.png
    INDU-60min_m_25-7-12.png
    40.7 KB · Views: 340
Momentum is strong, so my Buy stop order is in 0.1 pt above the 2pm ET bar high.
 
Trade 2

Date: 26/7/12

DOW 30

Entry: 12922.6
Exit: 12892.1

Profit/Loss: -30.5

Highest high during trade: 12932.8
Low during trade: 12841.9
Max above Entry: 10.2
Max below Entry: -80.7
Slippage: 0.5

Entry Bar Time (US): 10.07am
Exit Bar Time (US): 10.27am
Total Trade length: 20 mins

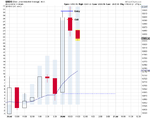
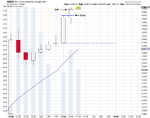
I got the fill above the high of the 2pm ET bar, 0.5 pts above my buy stop order and the DOW rallied 10.2 pts higher before stalling and reversing hard, and hitting my 30 pt stop loss. But there might be another chance to make it up later today.

attachment.php
 

Attachments

  • INDU-60min_26-7-12_1.png
    INDU-60min_26-7-12_1.png
    11 KB · Views: 1,713
Last edited:
Trade 3

Date: 26/7/12

DOW 30

Entry: 12864
Exit: 12879

Profit/Loss: +15

Highest high during trade: 12932.8
Low during trade: 12841.9
Max above Entry: 48.1
Max below Entry: -6.1
Slippage: 0.4

Entry Bar Time (US): 11.57am
Exit Bar Time (US): 12.28pm
Total Trade length: 31 mins

Trade 3 went to plan and helped make up half of the trade 2's loss. The slippage isn't great so far as have already had 1.2 pts in slippage in 3 trades. Below is the chart of the trade.

attachment.php
 

Attachments

  • INDU-60min_26-7-12_2.png
    INDU-60min_26-7-12_2.png
    11.9 KB · Views: 1,863
Last edited:
Trade 4

Date: 27/7/12

DOW 30

Entry: 12971.5
Exit: 12986.6

Profit/Loss: +15.1

Highest high during trade: 12999.9
Low during trade: 12944.2
Max above Entry: 28.4
Max below Entry: -27.3
Slippage: +0.1

Entry Bar Time (US): 10.05am
Exit Bar Time (US): 10.56am
Total Trade length: 51 mins

I had a bit of a mare with this one as I was late setting up my order ticket as I lost track of time. So I didn't place my order in time and missed the first 10 point move higher early in the hour. However, I resolved not to chase, as my rules are firm about the entry level, so I set a limit order which was filled when the market pulled back. The pull back was fairly steep though and I was within 2.7 points of getting stopped out. But the market came back later in the hour and my 15 point target was filled with a positive slippage of 0.1 pts for a change. Here's the chart.

attachment.php
 

Attachments

  • INDU-60min_27-7-12_1.png
    INDU-60min_27-7-12_1.png
    11.8 KB · Views: 1,684
Week in review

A reasonable first week for the forward test with 6 entry signals, of which there was 4 fills of 3 wins and 1 loss. Although I'm already getting annoyed at the slippage and price differences between my providers CFD quotes and the actual prices and so have been looking into proper futures brokers as I think a method like this needs something like Ninjatrader with it's order bracketing and price ladder, or X_Trader etc to work properly. So I have looked at Velocity and Mirus futures so far. Can anyone that trades the ES or YM in England recommend any other futures brokers that I could potentially use? Or are one of those the best options for small trades?

The method only gives about 4 or 5 trades a week, so say 40 round turns a month in the ES or YM.

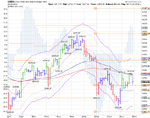
Below is the weeks chart of all the trades.

attachment.php
 

Attachments

  • INDU-60min_27-7-12_Week.png
    INDU-60min_27-7-12_Week.png
    34.4 KB · Views: 1,828
There hasn't been any positive momentum so far this week, so no trades for me as yet. Although that could change in the next few days with the ADP, ECB meeting, jobless claims and the Non-farm payroll data.

attachment.php
 

Attachments

  • sc.png
    sc.png
    34.9 KB · Views: 1,534
I started forward testing a simple rules based momentum method on the Dow 30 Index yesterday and thought it would be useful to start a new journal so that I have a visual aid showing each trade as well as my excel spreadsheet that I always keep. I've been manually back-testing it for a while and the results show some potential, although I've still got another year of 60 minute charts to go through to get it up to date.

I've been experimenting in excel with different target sizes, such as 30, 20, 15 and 10 points above entry with a 30 point stop loss, and although all are profitable on paper with the 30 point target making the most, the volatility is also greater and win/loss rate improves considerably with the smaller targets. For example, a 30 point target has a 62.89% win rate, whereas the 10 point has an 83.02% win rate. So I've gone with the 15 point target for my forward test, which has a 77.99% win rate from my small sample of trades on the back test, as I know some of that will be eroded through spread, slippage, and my entries occasionally being too slow when the market's moving strongly. Also my manual testing has been done using the index data on stockcharts, so there will be differences with my CFD brokers charts as well which could further erode any edge the method might have. But that's what the forward testing is for.

Attached is the back test graph results, showing the differences between the various target sizes. The graph is a years worth of trades between Nov10 and Oct11, but it only totals 159 trades so it is a very small sample and as such the accuracy of the results is likely very low.

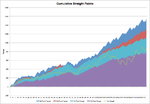
I dont understand why you've gone for 15 points profit? Your chart clearly suggests 30 points (or more).

Also, on your other charts, what are the blue histogram bars?

Nice work.
 
I don't understand why you've gone for 15 points profit? Your chart clearly suggests 30 points (or more).

Also, on your other charts, what are the blue histogram bars?

Nice work.

Hi D70, there are a few reasons for picking the 15 point target instead of the 30. Firstly, the DOW index data in the back test is the perfect spot data, so it's not identical to my brokers price data as they add a 0.7 point spread and also have variances of +/- a few points on each hours bar. This is unavoidable with a cheap provider as they are simply trying to match the index price I believe. So to trade the real market prices I'd need to use a true DMA broker and trade the proper sizes. Which with a futures provider like Mirus or Velocity would be $5 a point on the YM (DOW 30 futures) for 1 lot, which is a fair bit bigger than I want to trade yet, as with my 30 point stop that's $150 plus commission risk per trade. So, I've chosen the 15 point target as it has a much higher win rate and lower volatility, which I'm hoping even with the price variance will still come out ahead. As the the variance is big enough to erode the edge on the 30 point target completely so that it's no longer as profitable.

Another factor to consider is time, as a longer length of trade will increase the risk of a reversal as the momentum fades. So far the trade length on a 15 point target has been under 30 mins mostly, but the 30 point target would stretch that out to 2+ hours on average I believe (that's not hard data, but my observation when doing the manual back testing), and so to reduce the risk I feel the 15 point target is more sensible.

The blue histogram bars on the chart are the macd histogram. Momentum is determined to be positive when both the 13 bar exponential moving average and the histogram are rising together.

Fair enough explanation but you're making some pretty big assumptions on the market which I think your data contradicts.

Also, I would look past hit rate. It means absolutely nothing. You can have a hit rate of 99% and lose money.
 
Hey Mate - can you explain what you are doing here ?

I see some pivots ?
 
Fair enough explanation but you're making some pretty big assumptions on the market which I think your data contradicts.

Also, I would look past hit rate. It means absolutely nothing. You can have a hit rate of 99% and lose money.

Agreed, there are big assumptions, but it seems sensible to me to go with the lower volatility that the 15 point target appears to have as a starting point. It's a forward test so I'm collecting the data with each trade like the highest high it reached without being stopped out and the lowest low it produced during the trade, so in time if it's going well, but the data suggests the target could be adjusted then I'll have more confidence to do that.
 
Hey Mate - can you explain what you are doing here ?

I see some pivots ?

The pivots aren't relevant to the method. I just like to have the weekly pivots on the chart to see what zone the market is trading in.

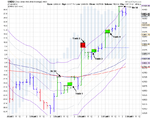
The method is simply to place a buy stop above the hourly bar once the momentum has turned positive, which is determined by the 13 bar exponential moving average and the macd histogram both rising at the same time. So on the weekly roundup chart you'll see them colour coded and on the first positive (green) bar, I then place a buy stop order 0.1 point above the high of that bar with a target of 15 points and stop loss of 30 points, which I've determined from my manual back test. I found it works best on the S&P 500, but with a bucket shop broker like I have I need to have the smallest spread possible and so the spread on the DOW 30 is much smaller and so a better option for me currently to trial it. But if I was using futures I do it on the ES as the additional liquidity makes the pullbacks less severe and so is less likely to be stopped out.
 
Momentum is positive at the open, so we'll see if it holds until the end of the hour and if I get an entry signal. There is also a good amount of space in the channel as it's below the 1ATR level still, so I might get a trade today.

attachment.php


EDIT: The price didn't hold up, but the momentum is positive for the time being, so I've put my order in. But expect it won't be filled, as the first bar had a large range. So my plan when this happens is to put the order in, but if it doesn't get filled in the hour and the momentum is still positive then the buy stop will be moved above the 3pm bar high instead. However currently as you'll see in the below chart, the momentum has gone to neutral, so the order would be cancelled at the end of the hour if that stays the same.

attachment.php


EDIT: The momentum stayed positive so I've moved my buy stop above the 3pm (10am US) bar high.

attachment.php


EDIT: The momentum signal is still hanging in there, so I've moved my buy stop again, and it's now above the 11am ET bar high.

attachment.php
 

Attachments

  • sc-1.png
    sc-1.png
    40.4 KB · Views: 728
  • sc-2.png
    sc-2.png
    40.7 KB · Views: 718
  • sc-3.png
    sc-3.png
    40.8 KB · Views: 691
  • sc-4.png
    sc-4.png
    40.9 KB · Views: 679
Last edited:
I finally got filled, although it gaped through my boundary order, so I had to resubmit the order and it was filled on the pullback.

attachment.php
 

Attachments

  • sc-5.png
    sc-5.png
    40.9 KB · Views: 633
Trade 5

Date: 1/8/12

DOW 30

Entry: 13054.9
Exit: 13024.3

Profit/Loss: -30.6

Highest high during trade: 13058.9
Low during trade: 13020.8
Max above Entry: 4
Max below Entry: -34.1

Entry Bar Time (US): 1.06pm
Exit Bar Time (US): 1.59pm
Total Trade length: 53 mins

No joy today. The breakout was very weak and quickly reversed.

attachment.php


attachment.php
 

Attachments

  • INDU-60min_1-8-12_1.png
    INDU-60min_1-8-12_1.png
    11.4 KB · Views: 730
  • sc-6.png
    sc-6.png
    41.4 KB · Views: 747
  • Like
Reactions: D70
I didn't get any trades today as the momentum was negative most of the day and turned neutral in the last 2 hours. A close above 12908 in the first hour of trading tomorrow will likely give me a entry signal to place a buy stop order, as that should turn the momentum back to positive again, but who knows with the job number an hour before the open, as it could go either way here.

I'm only using the price data from the US market hours, so 9.30am to 4pm US ET, as that's where the most liquidity is in the trading day. However, I am considering dropping the first 30 mins of the US session, as I've noticed visually that the majority of the biggest losses with this method occur with trades entered on the second hours bar following a signal from the first 30 mins of trading. So I need to go back through my backtest and add the entry times of each trade so that I can see whether the data backs up what I think.

Here's the up to date chart.

attachment.php
 

Attachments

  • sc-8.png
    sc-8.png
    43.8 KB · Views: 697
Momentum is positive at the open, and so I have to wait until the end of this hour to see if it holds onto it. It would need to reverse below 12923 to go neutral again although it's back up in the resistance from a few days ago, so I will wait and see if I get a entry signal.

attachment.php
 

Attachments

  • sc-9.png
    sc-9.png
    33.1 KB · Views: 699
That was a very quick trade. In and out in less than 2 minutes for 15 point gain. Will do a full write up later when I have the rest of the data.

attachment.php
 

Attachments

  • sc-10.png
    sc-10.png
    33.6 KB · Views: 697
Top