isatrader
Senior member
- Messages
- 2,965
- Likes
- 136
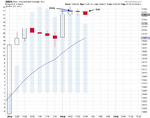
Trade 6
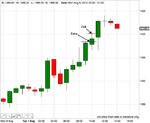
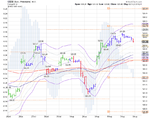
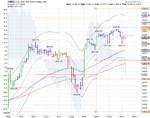
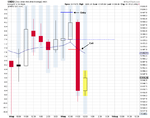
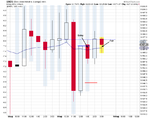
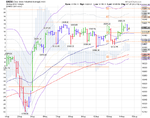
Date: 3/8/12
DOW 30
Entry: 13082.6
Exit: 13097.6
Profit/Loss: +15
Highest high: 13134.6
Lowest low: 13079.7
Max above Entry: 52
Max below Entry: -2.9
Entry Bar Time (US): 10.00 am
Exit Bar Time (US): 10.01 am
Total Trade length: 1 min
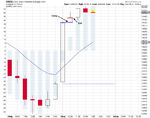
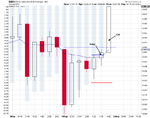
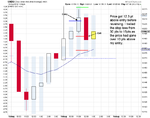
A successful trade today, with the 15 point target being hit in just over 1 minute after my buy stop order above the opening hours bar was filled. Also no slippage today for a nice change.


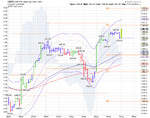
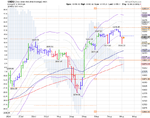
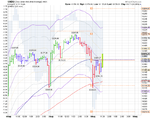
Date: 3/8/12
DOW 30
Entry: 13082.6
Exit: 13097.6
Profit/Loss: +15
Highest high: 13134.6
Lowest low: 13079.7
Max above Entry: 52
Max below Entry: -2.9
Entry Bar Time (US): 10.00 am
Exit Bar Time (US): 10.01 am
Total Trade length: 1 min
A successful trade today, with the 15 point target being hit in just over 1 minute after my buy stop order above the opening hours bar was filled. Also no slippage today for a nice change.