isatrader
Senior member
- Messages
- 2,965
- Likes
- 136
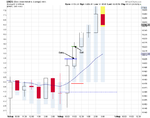
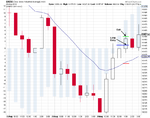
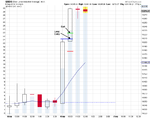
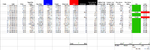
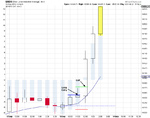
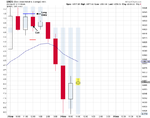
Trade 12
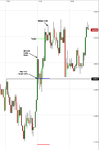
Date: 16/8/12
DOW 30
Signal Bar High (10:00 to 11:00 ET): 13205.18
Entry: 13205.3
Exit: 13220.3
Profit/Loss: +15
Highest high: 13269.32
Lowest low: 13200.33
Max above Entry: 64.02
Max below Entry: -4.97
Entry Bar Time (US): 11.15 am
Exit Bar Time (US): 11.50 am
Total Trade length: 35 mins
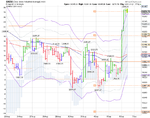
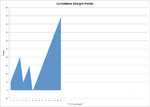
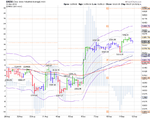
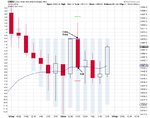
A strong momentum move today, and a reasonably quick trade of 35 mins. So gives me 2 wins and 1 loss this week, but, as I trailed the stop on the losing trade the week finished up +16.3. Here's the marked up chart of today's trade:


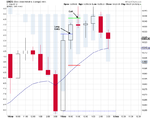
Date: 16/8/12
DOW 30
Signal Bar High (10:00 to 11:00 ET): 13205.18
Entry: 13205.3
Exit: 13220.3
Profit/Loss: +15
Highest high: 13269.32
Lowest low: 13200.33
Max above Entry: 64.02
Max below Entry: -4.97
Entry Bar Time (US): 11.15 am
Exit Bar Time (US): 11.50 am
Total Trade length: 35 mins
A strong momentum move today, and a reasonably quick trade of 35 mins. So gives me 2 wins and 1 loss this week, but, as I trailed the stop on the losing trade the week finished up +16.3. Here's the marked up chart of today's trade: