Dentalfloss
Legendary member
- Messages
- 63,404
- Likes
- 3,726
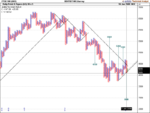
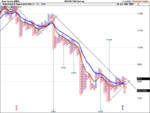
just got a downside vertical count of 3000 ish.not activated as yet.needs a break below 4000 to viable.however,this chart is still bullish.price has bounced off the uptrend line
eod data.box size is 50 points.hlo data.3 box reversal
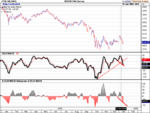
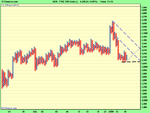
i will look later to see if the chart/candlestick is showing revers divergence on the daily
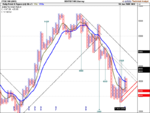
eod data.box size is 50 points.hlo data.3 box reversal
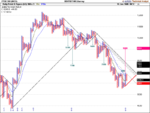
i will look later to see if the chart/candlestick is showing revers divergence on the daily