Newtron Bomb
Guest Author
- Messages
- 1,602
- Likes
- 87
Hi all
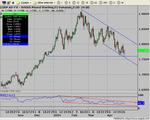
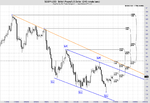
GBP daily
We are definitely seeing another congestion period at this level on GBP which we also saw in dec of last year with 1.7580 support @ the 38% fib retracement level from September 03 lows (not noted on chart).
A clear medium term downward trend has been formed, but am still on the fence as to a clear direction although i am still leaning on the bear side mainly because am short lol 😆 i'm targeting 1.75 and have been for a while but if we do see a down turn am optimistic for 1.70 until the charts tell me otherwise
Maybe there are clues in RSI as to the direction. Time will tell with this
NB
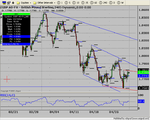
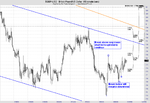