May '04 Forex

Newtron Bomb

Guest Author
Messages
1,602
Likes
87
Hi all

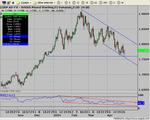
GBP daily

We are definitely seeing another congestion period at this level on GBP which we also saw in dec of last year with 1.7580 support @ the 38% fib retracement level from September 03 lows (not noted on chart).

A clear medium term downward trend has been formed, but am still on the fence as to a clear direction although i am still leaning on the bear side mainly because am short lol :LOL: i'm targeting 1.75 and have been for a while but if we do see a down turn am optimistic for 1.70 until the charts tell me otherwise

Maybe there are clues in RSI as to the direction. Time will tell with this

NB
 

Attachments

  • 26-04-04 gbp d.png
    26-04-04 gbp d.png
    22.6 KB · Views: 561
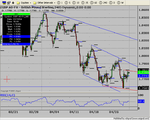
GBP 240 min

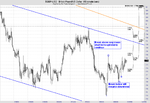
You can clearly see there is a channel forming on the 240 min chart but what is making me stay on the fence is the change in slope of the channel. Could this be a turn? A reaction from 38% fib? 1.7820 level is a key figure at the moment imo and the area has been either the high or low of the day on several occasions.
This level may hold as resistance for now and if the channel does hold at least there is a 2cent range to play with.

NB
 

Attachments

  • 26-04-04 gbp 240.png
    26-04-04 gbp 240.png
    24.1 KB · Views: 482
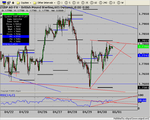
GBP 60 min

Zooming in to the 60 min shows me the new potential range and a lower top being formed below 1.78. It will be interesting to see what will happen next week to see if the price does range or break out and test 1.79 staying within the larger channel seen on the 240 min chart. If this does happen it will be a nice quick 1 cent move.

In favour of a BO is Chartmans R/S switch that we see so many times on the dow and it would be interesting to see if this plays out here. If so this is the clue we need to to have longs a the ready.

NB
 

Attachments

  • 26-04-04 gbp 60.png
    26-04-04 gbp 60.png
    23.7 KB · Views: 491
There are a few scenarios that could happen but basically we looking at long short or sideways lol :LOL: :LOL:
The point is we know what could happen when it could happen and where it could happen with a little chart reading.
Ive got my plan based on some of the things that ive mentioned here. And i just though that i would share my thoughts with you all for the longer picture.

Hope it helps
NB
 
Fantastic Analysis Newtron,

Is this the ascending triangle you were talking about, it looks as if it took a long time for this one to form, 2 days? Would that indicate that if the resistance was to be brocken, a strong trend upwards would be created?
 

Attachments

  • snapshot-2.png
    snapshot-2.png
    52.2 KB · Views: 478
Last edited:
Nice analysis NB

Agree with your point on congestion.

I am also leaning to the bearish side and feel that once 7550 area broken there is not much but thin air between that level and 7380.

I do think that 7550 is a bit of a tough nut to break - I have included levels on the weekly chart. Hope they help

The market will always be right LOL
 
Ilia King

Yes i think i mentioned it the chat room, i dont think the length of time is particularly important as long as the pattern forms and it completes to target. I would suggest that this pattern, on the 30 min chart that you have illustrated, will fail. It may drift out of the pattern with the asian session trading. However, it could move like a rocket and even if it does BO am not sure it will reach target.
I am really on the fence as i can see equal weighting for moves in both directions and reasons for further consolidation. There is a lot of gut feeling involved at the moment as to what may happen.

As to direction of a bigger movement i have seen a failed reversal on the daily charts for a long and a failed short. So it would be difficult for me to say for certain a direction, but then i dont do predictions i just trade what develops on the chart.

The biggest factor for me shaking the dust off the bear cap is the daily chart. The trend is down. The price rises that we see cannot be sustained and are followed by a sharp fast sell off


Happy Trading
NB
 
NB: re congestion

Sorry - was in a bit of rush this morning - some of the congestion was caused by an Asian name selling cable at the figure down to 7680, a UK clearer buying it back to 95 and at the same time a German name selling the cross.

There was also fix related buying on EUR/GBP which saw the move from 0.6750 and cable took a bit of a dive from 7775 to the 7730/25 area.

All this on top of funds squaring for month end and thinning liquidity leading to the holiday lead to cable looking somewhat indecisive.

GL and GT
 
GBP Short/Medium term observations

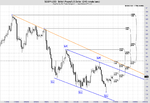
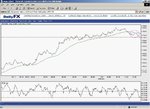
In 240 min chart, GBP is forming lower lows and lower highs so is clearly in a downtrend. Unless it changes its mind & tells me by breaking the pattern, I'll go in with bearish view in the market.....
 

Attachments

  • gbp trend 1.png
    gbp trend 1.png
    206.9 KB · Views: 366
Now 60 min chart

However, in 60 min chart it has made higher lows but no higher highs. A break above recent high of 1.7817 may mean short term uptrend will continue, untill it finds resistance. That resistance could be around 1.7903-1.7930 region, or on the trendline before that.

Until the price breaks 1.7660-91 area, or goes up to resistance & makes lower highs & lower lows, I dont intend to take any bearish positions.

Regards

Vandana
 

Attachments

  • gbp trend 2.png
    gbp trend 2.png
    176.6 KB · Views: 368
Webwolf
Interesting info on the reasons to the moves.

Fibcouple
great charts... like the way the fibs are presented on your charting package. Is that your own study formula or is it a part of the software you have?

Happy Trading
NB
 
Charting

Hi NewtronBomb

The charting package I use is Trade Navigator Gold by Genesis but to get the way the fibs are arranged, one needs a package called 'fibnodes' which is an add-on. It is proprietary to Joe DiNapoli.

By arranging fibs this way, the clutter doesn't confuse at the critical moment and also it is easy to read the charts as well.

Regards
 
A quick update regarding GBP 60

It clearly looks like 1.78 acting as strong resistance and for now the new channel is looking good and if so teh target should give me a ride down to 1.7550.

I will be keeping my eye on these paterns within patterns.

NB

03-05-04_gbp_60m.png
 
JT's system

JT's system has pound, the Yen and gbp/chf short ( 7am 10am range)

But I wonder if Bank Holiday affects trading in UK

US may be more indicitive of direction about 1.30pm - No Bank Holiday for them ?
 
Last edited:
GBP/USD still trading

Looks like they were stopped out apart from the GBP/USD
:eek:
 
Last edited:
NB: re Interesting info on the reasons to the moves.

One useful source of information is www.global-view.com

It contains two threads of primary interest:
1. Forex Forum - free - used by FX traders of all types
2. GVI Forum - subscription based - used by those working FX banking and Financial Institutions

Both technical and fundamental information is discussed. It isn't setup the same way as Trade2Win, which has far more topics and continuity, but has a daily conversational feel to it with levels, stops, orders and buyers/sellers being posted by the contributors. As with any forum there are good and not so good posters LOL.

Hope this helps
 
morning all. like the new site layout. rather futuristic, and in a way reminds me of championship manager 03/04 , which is no bad thing.

have been tinkering with strategies over the weekend, and went live this morning trying to appliy chartman's 100 ema strategy to cable. first trade has been a belter as it has trended north all day. currently +90, and im trailing my stop.

essentially, the strat is to trade off bounces/rejections of the 100EMA, and stay in the trade unless +/- 20 points from the EMA, or you get PD/ND on RSI (14). seems to be working ok thus far. why oh why was i only testing it at £1 a point.

still, its a learning curve :)

did everyone have a good weekend then?

FC
 
For those following 1am-8am breakout system an excellent start today.


Limit orders on all 4 currencies have been filled although only using Capital Spreads virtual account whilst experimenting with this against 8am-10am system.

Current position:

Euro/USD-Long@1963. +71

GBP/USD-Long@7761 +129

USD/CHF-Short@2978 +67

USD/[email protected] -23

Lets hope this keeps up!!!!
 
bloody hell TW, if only you had real bucks on the line!!!

good to see it seems to work accross all the pairs.

odd how the GBP/USD is well in the money, and yet USD/JPY isnt too far down. most of this move must be due to sterling strenght, perhaps ??

FC
 
pour example...

here we go guys, now short on cable after it dipped below the 100 ema, and then failed to break it once more.

short from 1.7890. coincides with round number rejection.

lets see what happens.

FC :)
 

Attachments

  • 100 ema rejection.jpg
    100 ema rejection.jpg
    113.2 KB · Views: 295
Top