Market chat

Thanks for all of your posts on Level II screen interpretation and T/A Naz - great stuff and valuable guidance for us 'students'!

I find it easier to pick up on the Level II rationale than the T/A - have you any plans for a T/A seminar? - a subject that could keep an audience going for quite a few hours I'm sure, or maybe you can recommend a T/A guide text book on the subject?

With plenty of talk about the coming 'Supermontage' system thats coming to replace Level II as we know it now, I've copied an article on the subject below - any comments would be appreciated!

Now what about SuperMontage? Isn't it replacing Level II?

SuperMontage will be upgrading and replacing the Level II as we know it today. SuperMontage will go in tandem with decimalization, and the already enhanced SuperSOES platform. It will deliver a fully integrated execution and order display system. Additionally, it will be addressing issues like market fragmentation, which should make it easier to locate much needed liquidity, along with the best and quickest execution prices for traders.

Unlike the current Level II, where Market Makers are only permitted to enter quotes at their best prices, SuperMontage will allow the Market Makers to post orders and quotes at multiple price levels. Other enhancements include Pre-trade anonymity, and greater transparency. SuperMontage will display five price levels deep on both the bid and offer in each stock. If a trader chooses to view beyond the top five tiers, a new summary scan feature will be available.

Market makers will have increased anonymity capabilities with SuperMontage. Instead of displaying the normal four letter Market Maker ID (MMID), (the acronym "MMID" will be replaced by "MPID": Market Participant Identifier), they will appear on the screen as "SIZE." These non-attributable "SIZE" orders will appear in aggregate form, and will not be identifiable to a specific Market Maker until after execution.

Another feature of SuperMontage is the Reserve Size. A Market Maker may choose to have a reserve aggregate, which will not be visible on SuperMontage. Hence, the reserve order will continually refresh at the price and size displayed by the Market Maker until the order is depleted. SuperMontage will eliminate crossed and locked markets (where the bid price is higher than the offer price).

Regards, TradeSmart
 
Last edited:
Thanks for your comments tradesmart.

When many of us traded level 2 Nasdaq in fractions,we were horrified when it traded in decimals and thought the end of our cunning stratergies were gone.After trading stocks at $200 and seeing them move $15 either way daily,it looked like the end of the world for scalpers now they're about $20.However these things happen and its having the underlying knowledge of the screen that helps a trader adapt.Say you know how Market makers used to do this or that then if you notice their play changes slightly then so do you,but its knowing how they used to play things that will enlighten you to any new tricks.

Its like playing a football match.The authorities might tinker with the rules slightly now and again,but the underlying skills of the players on the pitch dosnt change,they just adapt slightly to any new rules.Thats how its been with all the level 2 changes and thats how i expect it will be again.

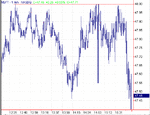
Many of the changes that have happened before i feel have benefited traders who have used t/a in conjunction with level 2 and i expect it will be so this time.For instance in the MSFT chart below whatever the changes,i still would like to be watching the level 2 Nasdaq screen as MSFT approached whole number resistance at $48.Because whatever the result and however i want to trade it i know i will get an exclusive insight before many by understanding the trading thats going on infront of my eyes on the level 2 screen.Its an edge that i'd rather have than not have.

On to your point about seminars.I have no plans to hold any seminars at the moment.However i'm still running one to one tuition at my live trading screens for any student at any level and that means from beginners to very large players.This will include t/a if required.These have always been very successful and i'm pleased that several training organisations have been sending me people.Without upsetting any of the regulars my email is email [email protected] if anyone is interested in any info.
 

Attachments

  • msft11.gif
    msft11.gif
    11.6 KB · Views: 813
Last edited:
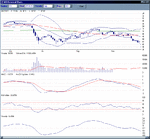
Not sure how I post a copy of my AIQ chart here folks, bu MO maybe worth looking at - maybe an island bottom on Friday ?

Juts under the $38 line after warning.

Risky of course, but worth keeping an eye on it..
 

Attachments

  • mo.gif
    mo.gif
    23.6 KB · Views: 684
Last edited:
Morris, get AIQ up, full screen, press "ALT Print screen " keys. this copies the chart to the clipboard. Then paste it into Paint shop pro etc. cut and paste to the right size ( about 800x 600 pixels) and save as a "giff" 256 colours.Then using the "browse" at the bottom of your thread, point to the giff.Then hit submit.
 
Ooops may a leetle on the large size...


Thanks CM.


That's a bit better...
 
Last edited:
If you include the indicator panel on the right, and just crop the chart, you will end up with the right size.
 
help
Is there anybody who has opened an account with IB to trade US stocks and futures, I need advice on which if any W8 tax forms I have to fill out to complete the application, can not get any sense out of IB on the telephone.
Thanks Neil.
 
Nasdaq.A potential island reversal leading into a fib level?
 
Just for interest only i want to make a case for a bounce.
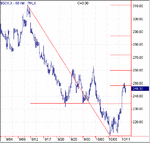
This is a chart of the $sox, the philli semiconductor index.Tier one general being INTEL.Notice the island reversal at the top. The 50% fibonacci retracement from there is at 260 as shown by the fib grid.if the $sox goes there and then retraces 50% it will form a higher low from the bottom at about 235, it will also use old support shown by the long red trend line.This 50% pullback from 260 would be a little similar to the same thing that happened last October and it then started a bounce that ran to December.
 

Attachments

  • sox1.gif
    sox1.gif
    9.1 KB · Views: 460
Here is a continuation of the post above.
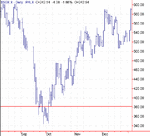
This is what happened last October to the $sox.You can see it made the double bottom ran to 420 and then retraced approx 50% to an old daily support level at 380,made the higher low and then bounced right through until December.Interesting?
 

Attachments

  • sox2.gif
    sox2.gif
    8.7 KB · Views: 452
Last edited:
Rolling Stocks...

Rollling stocks are are typically lower priced stocks that are trading between a support and resistance channel and this can be a great way to start out a small portfolio. We are looking for a consistent channel. Know your exit before ever going in and don't get greedy, be sure to do your homework and check if the stock has a good story behind it and always insure that the price has reached the lowest level and has now begun its roll back up and please refer to the special report on Rolling Stocks that all "paid members" receive. You can also use options on the more expensive issues (see the 3 option reports), a great way to play stocks without owning them.

The following is a list of potential rolling stocks:

MMSI $16.90 - $21.40

IFNY $6.45 - $8.60

CRMT $10.70 - $14.40

RHAT $4.40 - $5.50

IOM $9.40 - $12.60

Note: When you buy a Rolling Stock, always insure that the price has reached the lowest level and has now begun its roll back up.
 
Overtrading

I have now been trading fulltime for 2 years. Originally, I papertraded, everything seemed ok. But I was trading day after day. Soon I foundout I was losing alot of money. Reason was that I was overtrading. No matter what the market did, I bought or sold. My system was very complicated, using several indicators.
For what is worth, I have found that ALL indicators work in one degree or another. I now use a very simple system and concentrate on one market because I have found to my cost that one system may work for one index but not for another.
I use a simple 5 day ema (3 line). ie when the 5 day crosses the 15 day I buy or sell. It's simple, but it works for me. I looked at history of the Dow 30 index and over the last 3 years it only had 4 losing months.
My advice isstick to one index, ifthe Dow is too volatile the the Nasdac 100 and keep th system simple
 
Rossy - I agree that it is tempting to get too complex, and that often the simple techniques are what works best. Your system is as simple as it gets! But just relying on 2 ema's (5 and 15day) seems to infer that you rely on daily data only rather than intraday. Is this the case? How do you square that with the volatile markets we have today?
 
Hi Roger M. I use daily data only. Even thougt the market is very volatile there has been a downward trend since 29th Sept. I use the site www.bigcharts.com. each evening, set the interactive charts to Dow Jones 30 index and a 5 day ema.
I spreadbet using Finspreads Dow Jones future. You'll see that the lines crossed on the 29th Sept approx 8,700. So I sold using a stop loss at the previous days high. This gives me room if the next day the index goes up. The lines then crossed one the 11th Oct, so I bought closing the bet winning 900pts. At the same time I bought again opening another bet at 7,850. he market will hopefully open at about 100pts higher today. I am not saying I win everytime, as no system will do that, but once one is on and a suitable stop loss is put in place, generally the volatillity of the market doesn't matter. The only thing I say is don't be greedy and take points when you can. Hope this has given you food fr thought
 
Today shows the value of being in overnight sometimes. The Dow is currently up 275 points, so daytrading the Dow should be easy, right? But with over 200 points coming in the first 6 mins it has been stuck in a 70 point trading range all day - not so easy.

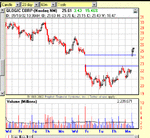
On a different tack, the attached 60 min chart showing the multi-day Island on QLGC is interesting. Now will it power away from here or close the gap?
 

Attachments

  • qlgc151002a.gif
    qlgc151002a.gif
    17.1 KB · Views: 410
Last edited:
Hi,
I've got a dilemma maybe someone could help me out, maybe more people could. I want to open a spread-bet account and after searching quite a bit I have found two of the spread-bet companies to have the best offers probably, CMC and Finspreads. I am thinking about betting on the S&P 500 daily and the spread is 0.5 in CMC and 0.7 in Finspreads. CMC seems to be more interesting because of the spread but are there any other advantages that Finspreads has over CMC? I know about the fact that you can bet with much less money, taking less risk at Finspreads but I think an additional 0.2 spread is quite a lot. Any thoughts or suggestions? Does anyone have some experience with any of the companies?
Thank you!
 
Top