You are using an out of date browser. It may not display this or other websites correctly.
You should upgrade or use an alternative browser.
You should upgrade or use an alternative browser.
Naz
Experienced member
- Messages
- 1,391
- Likes
- 25
Barry
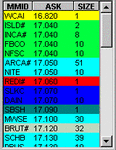
The very top price on the screen is the inside bid and ask.
----------------------------------------
That example was for demonstration purposes only there is an awful lot more to it than many think. Part of the play is using the direct access into the level 2 screen,where the trader becomes a market maker and can add another dimension to his trading.You want to trade the stock but hey i've got every tool at my desposal so lets make sure i earn some extra profit by working my order on the screen.
Last edited:
neil
Legendary member
- Messages
- 5,169
- Likes
- 754
Bid/Ask
Let me get this straight Naz:
The res. at 260 Ask above (Wide band of people offering me shares at 260) indicates demand being met by willingness of seller to satisfy demand at that price because the seller is in effect unloading a pile of shares (Distribution) expecting prices to go down? 😕
Let me get this straight Naz:
The res. at 260 Ask above (Wide band of people offering me shares at 260) indicates demand being met by willingness of seller to satisfy demand at that price because the seller is in effect unloading a pile of shares (Distribution) expecting prices to go down? 😕
Naz,
Whilst I agree that L2 can be useful I think your a bit over the top in your posts. I day trade Nasdaq stocks using direct access and have been profitable now for many consecutive months.
You often talk about never paying the spread but in reality I have found that the best trades are made by simply taking the spread (still using direct access so that you have total control over the execution price). After all, most Nasdaq stocks have spreads of only a few pence (liquid ones usually 1p) so what the point in trying to gain such a small amount? In addition, you generally find that if you try to buy on the bid and sell on the ask you will only get filled when the price is moving against you.
You also state that L2 shows S/R levels not evident on the chart. I agree that this is the case sometimes. But it is not realiable enough to trade. IMO L2 will only show S/R that is relevant for merely a few seconds. The L2 screen will swing from looking bullish to bearish within seconds. For example, if Microsoft has traded up to say round number resistance of $49 there will normally be a mass of quotes lining up on the ask side. In practice however, these quotes will simply be lifted as the inside price approaches. You see MM know that people will try and use L2 to trade and will do everything to hide their true intentions. i.e. a MM could be sitting on the ask at $49 but accumulating stock through one of the ECN's.
I'm not trying to have a dig at you and if you trade profitably well done. I just think that people ought to know that L2 is not and never will be the 'holy grail'.
Fair comment, but then we all know there is no Holy Grail. We also know that just because one person trades in a particular way, that way isn't the only way or the best way. For that particular person, they may well feel it is the best way- and for them it is undoubtedly true. I chuckle at NAZ's posts sometimes, knowing he is having a ball at the expense of some one else, hopefully the MM's.No doubt he gets great satisfaction from squeezing the last cent out of his trades, but that doesn't appeal to me, nor you by the sounds of it. Nonetheless, we all enjoy gaining our edge, howver it may come about.
Naz
Experienced member
- Messages
- 1,391
- Likes
- 25
Spoon.
Thanks for your post.I'm glad your doing well trading the Nasdaq with level 2.I thought someone would bring this all up.Every trader is at different levels of understanding.If one tries to show people who dont trade it a more complicated environment they wont have a clue.So the idea was to make an example clear enough for people to follow.Trying to show with one snap shot something which is forever moving and changing is difficult.
If anyone wants market maker tricks and fakes i've got a CD out that shows some of those.
The next thing is that direct access is part of the game and having full control over this increases your effectiveness on the screen.Sure when i first started doing it i'd try and buy on the bid and get hit because the stock was going down so it seemed easier to pay the ask and get in.
But playing the stock like a market maker and making spreads instead of paying them does this.
1. Allows you to make spreads in pre and post market,that even on MSFT can be 25c.
2.Allows you to realy get good at taking your short positions.Wait until the stock turns and with stock now showing a down tick you won't get a short on.
3.Allows you to play less liquid stocks with larger spreads.
4 Even if a liquid stock has a 1c spread nimble use of direct access allows you to buy underneath the bid and capture an extra 3-4c and sell above the ask which can sometimes add 4-10c to your trade.But then thats another story.
5.Makes you think like a market maker and not like a trader,which means eventualy you see the turns and the fakes quicker and this allows you to profit from it.
6.Constant use of doing all this keeps your skills sharp.
Do i still buy on the ask,yes if i've no option i will.Who taught me to buy on the bid and use the all the direct access skills a young superstar New York trader from Wall Street who makes that young lady that makes $150,000/month look pedestrian.
After trading with that young man day after day,believe me making the screen work for you is the untold story.
Last edited:
Naz
Experienced member
- Messages
- 1,391
- Likes
- 25
I know that there are lots of islands at the moment on the Nasdaq after last week.I love INTELS.But my charts concern Weds before the reversal right at the very top when the best profitable short play was to be had.Notice MSFT at the whole number,$51.Also INTEL at the whole number $17 and also at a fib level from its last major move down (the end play of which is just visible in the left corner of the chart).Even on the pullbacks later in that day they both moved back to whole numbers.Smart reading of level 2 screens of both stocks at the key levels will have told you not in one snap shot but over a little time,hey they're selling this level,they dont want to know,there is no strength in taking it solidly through.
This gave even daily players a chance to short the stocks or others an insight into the next probable move of the Nasdaq index itself.Level 2 Nasdaq is not only for manic daytraders it is for every trader in every time frame.It is not the holy grail but it sure does give that edge when it comes to deciding when to take your trades.Even dare i say Uk traders could well benefit by keeping an eye on INTEL and MSFT.A download on exactly this is available shortly on www.clickevents.co.uk. Every trader is different and my e mail address is still available for any private questions.e mail [email protected]. NAZ.
This gave even daily players a chance to short the stocks or others an insight into the next probable move of the Nasdaq index itself.Level 2 Nasdaq is not only for manic daytraders it is for every trader in every time frame.It is not the holy grail but it sure does give that edge when it comes to deciding when to take your trades.Even dare i say Uk traders could well benefit by keeping an eye on INTEL and MSFT.A download on exactly this is available shortly on www.clickevents.co.uk. Every trader is different and my e mail address is still available for any private questions.e mail [email protected]. NAZ.
Attachments
Last edited:
marketwatch
Newbie
- Messages
- 3
- Likes
- 0
I wrote intra-day technical analysis reports for FX and futures traders working for many financial institutions. My reports were disseminated via Telerate and they paid an annual subscription. Each year over Xmas drinks I discussed how my reports helped them. Overwhemlingly they said that they reduced the size of their losing trades while the size of their winning ones stayed much the same. Basically, if their view matched mine then they traded as they would and if their view differed from mine then they employed my trading levels and closed out earlier.
On occasions I was "certain" which way a market was going and to what level. They always picked up on this and many traded blindly with my view. If I got it wrong then the phone rang all day, if I got it right then I heard nothing.
Steve
On occasions I was "certain" which way a market was going and to what level. They always picked up on this and many traded blindly with my view. If I got it wrong then the phone rang all day, if I got it right then I heard nothing.
Steve
Hey Naz,
Just had an e mail from the nasdaq tourist board.
'Welcome to the sunny Nasdaq, the best place to be for island hopping in the warm tempting waters of the financial world.
Research has shown us that people prefer islands, and we have an ongoing scheme to introduce as many islands as we can on an almost daily basis.
Relax with a bit of bottom fishing if that's more your style, but be wary of the strong undercurrents in these waters; Or for the more active amongst you try swimming with the sharks of these waters, as you try to stay ahead of the shoals of unsuspecting sprats and mackeral.
Whatever your into, you and your bulging wallet can be assured of a warm welcome as we try to fleece as much as we can from your bank account.
Come back soon (again and again) to the islands were tourists mix with the colourful locals adept at games like the Three card trick. Find the greenback, and the every popular, Predict my direction.
Assuring you of a sunny welcome.
A. Greenspan. G.O.D.
Resort director and boss of the rest of the free world.'
Naz
Experienced member
- Messages
- 1,391
- Likes
- 25
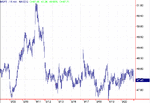
I dont know about others but i can only see a continuation of these falls.I like to check out MSFT just to make sure and i've seen this pattern many times this year on Nasdaq stocks.An island reversal (just visible at the top of the chart) followd by a consolidation and then a collapse through the consolidation.
Attachments
Naz
Experienced member
- Messages
- 1,391
- Likes
- 25
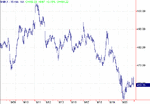
As a continuation from the post above.Here is a chart of the $nbi which has done exactly what has happened so often when an island reversal has formed followed by a consolidation.By the way the best version of this pattern that i posted was on 20/3/02 on this thread when the Nasdaq 100 was about 1520 now its showing just 871.
Attachments
Last edited:
Similar threads
- Replies
- 9
- Views
- 5K
C
- Replies
- 3
- Views
- 4K


