Hi everyone
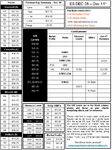
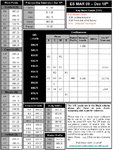
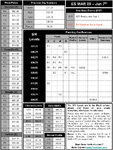
Please find attached todays levels. The S/R numbers are in the black column, the MP, Pivots, Fibs, Simple Moving Averages and Summary Numbers are for confluence and information.
Always remember to use the numbers as a guideline for potential areas of high probability plays.
Always use a set up based upon your system to enter a trade
.
Good trading all
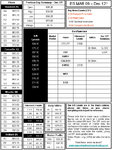
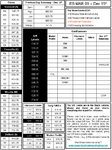
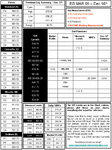
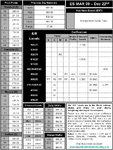
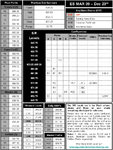
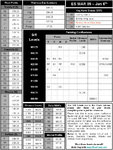