Indicators are liars! Support and Resistance Trading for the S&P emini

Hi everyone

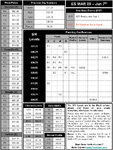
Please find attached todays levels. The S/R numbers are in the black column, the MP, Pivots, Fibs, Simple Moving Averages and Summary Numbers are for confluence and information.

Always remember to use the numbers as a guideline for potential areas of high probability plays.

Always use a set up based upon your system to enter a trade
.
Good trading all
 

Attachments

  • supportandresistance 11-12.jpg
    supportandresistance 11-12.jpg
    158.9 KB · Views: 162
Hi everyone

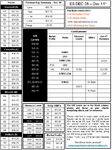
Please find attached todays levels. The S/R numbers are in the black column, the MP, Pivots, Fibs, Simple Moving Averages and Summary Numbers are for confluence and information.

Always remember to use the numbers as a guideline for potential areas of high probability plays.

Always use a set up based upon your system to enter a trade
.
Good trading all
 

Attachments

  • supportandresistance 12-12.jpg
    supportandresistance 12-12.jpg
    156.2 KB · Views: 175
Hi everyone

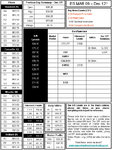
Please find attached todays levels. The S/R numbers are in the black column, the MP, Pivots, Fibs, Simple Moving Averages and Summary Numbers are for confluence and information.

Always remember to use the numbers as a guideline for potential areas of high probability plays.

Always use a set up based upon your system to enter a trade
.
Good trading all
 

Attachments

  • supportandresistance 15-12.jpg
    supportandresistance 15-12.jpg
    154.3 KB · Views: 178
Hi everyone

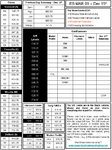
Please find attached todays levels. The S/R numbers are in the black column, the MP, Pivots, Fibs, Simple Moving Averages and Summary Numbers are for confluence and information.

Always remember to use the numbers as a guideline for potential areas of high probability plays.

Always use a set up based upon your system to enter a trade
.
Good trading all
 

Attachments

  • supportandresistance 16-12.jpg
    supportandresistance 16-12.jpg
    157.4 KB · Views: 183
Hi everyone

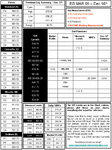
Please find attached todays levels. The S/R numbers are in the black column, the MP, Pivots, Fibs, Simple Moving Averages and Summary Numbers are for confluence and information.

Always remember to use the numbers as a guideline for potential areas of high probability plays.

Always use a set up based upon your system to enter a trade
.
Good trading all
 

Attachments

  • supportandresistance 18-12.jpg
    supportandresistance 18-12.jpg
    182 KB · Views: 196
Hi all...

Here's my 2 cents worth.

First off is the fact that 95% of traders fail so do something different than that 95%. Follow the crowd and you will get the same results.

The absolute best indicator is the price action, hands down. Trading is a probability business so when watching price action you better your odds when you trade a price action momentum trade.

Throw out all your indicators and learn to read price action for about 6 months. Simply watch the price on your trading platform, not your charts. Just use simple bar chart to make sure you are getting out before support & resistance levels are hit.

I will never use an indicator again. You need to understand market rythm, not rely on after the fact lagging indicators! The Price Never Lies or Lags. Common sense my friends!

If you treat trading as a business by taking small losses & bigger wins you can do it.

If anyone has any questions just let me know.

Bud
 
Input from a converted

I agree with the above poster. Price action is where it's at. This comes from someone who was a big fan of indicators.

I have found once the indicators are removed it's like someone turned the lights on.

I do still have an MACD on my larger t/f just for the odd divergence play. However, I only enter on a price action setup on my smaller T/F.

I look at indicators on charts like I would look at an indicator on a car. Just because someone signals left doesn't mean you would just pull out. You would make sure that the car was slowing, and positioning itself for the left turn. Then you would pull out.

Indicators on charts are the same. They are an indication that it might happen, but in this instance you need to see the price behaving in a way that suggests it's going to go down or go up.

I used to put way to much deference on indicators and trying to find a holy grail set of numbers to input. However, I finally saw that all indicators do is indicate that something might happen, they are CERTAINLY not the holy grail.

In fact IMO the holy grail is your ability to read price action. The better you can read the price the more chance you have of success. The more reliability you have on indicators the less likely you are to have success.
 
In fact IMO the holy grail is your ability to read price action. The better you can read the price the more chance you have of success.

Any tips about good learning stuff for this?

I`m justing trading for 2 months now and cant trade with indicators any more, total disaster.. I`m using now S/R + MACD, which has helped..
 
Any tips about good learning stuff for this?

I`m justing trading for 2 months now and cant trade with indicators any more, total disaster.. I`m using now S/R + MACD, which has helped..

Hmmm, there are some books on it but I haven't read any personally. There are bound to be more well read people on here than myself.

The ability to read price action in my opinion is one of those things that comes with experience. The more time you look at charts the better the chance that something will sink in.

Generally I look for high highs and higher lows for an uptrend and lower lowers and lower highs for a down.

The problem I think with someone teaching it is the fact it's very subjective.

PS. MACD is an indicator.
 
Just pay your dues by watching price action movement. Do this daily for a few months and I bet something will click. Then do it again for another few months and something else will click.

Like the above poster said! Experience is the best. By doing this you will also be able to come up with your own trading personality and not following the crowd.

Bud
 
Any tips about good learning stuff for this?

I`m justing trading for 2 months now and cant trade with indicators any more, total disaster.. I`m using now S/R + MACD, which has helped..

Jack Schwager's "Technical Analysis" goes into most of what is available and he points out the faults , while not suporting any particular method.

What I like about this book is that it is full of charts showing what was done, on the facing page, while the back page shows what actually happened.

With 774 pages, it might be a bit pricey, these days. I've had mine for years.

Split
 
Last edited:
Hi everyone

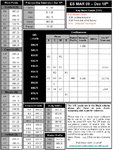
Please find attached todays levels. The S/R numbers are in the black column, the MP, Pivots, Fibs, Simple Moving Averages and Summary Numbers are for confluence and information.

Always remember to use the numbers as a guideline for potential areas of high probability plays.

Always use a set up based upon your system to enter a trade
.
Good trading all
 

Attachments

  • supportandresistance 22-12.jpg
    supportandresistance 22-12.jpg
    183.3 KB · Views: 189
Jack Schwager's "Technical Analysis" goes into most of what is available and he points out the faults , while not suporting any particular method.

What I like about this book is that it is full of charts showing what was done, on the facing page, while the back page shows what actually happened.

With 774 pages, it might be a bit pricey, these days. I've had mine for years.

Split

I tried to find the book on sunday but didnt find.. Just ordered today on Amazon..!
Also took most of indicators off my charts, I`m justing working with R/S and MACD.. Has helped...

Thanks
 
Hi everyone

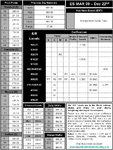
Please find attached todays levels. The S/R numbers are in the black column, the MP, Pivots, Fibs, Simple Moving Averages and Summary Numbers are for confluence and information.

Always remember to use the numbers as a guideline for potential areas of high probability plays.

Always use a set up based upon your system to enter a trade
.
Good trading all
 

Attachments

  • supportandresistance 23-12.jpg
    supportandresistance 23-12.jpg
    191.3 KB · Views: 179
I tried to find the book on sunday but didnt find.. Just ordered today on Amazon..!
Also took most of indicators off my charts, I`m justing working with R/S and MACD.. Has helped...

Thanks

Dont waste your time and money.Flags,pennants,breakouts,etc...
Let me ask you ,what are you looking to trade? S/R are fine,any indicator should be dumped,usually it will cause you to hesitate the entry,and exit premature.

Taking time off the chart will make it clear.Impulsive price action-which appears as a gap on stocks is how you can tell where to enter and exit.To view on a futures chart will require a range chart.
 
Hi everyone

Happy New Year! Received quite a few emails and messages whilst I was away will try to get back to everyone asap.

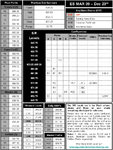
Please find attached todays levels. The S/R numbers are in the black column, the MP, Pivots, Fibs, Simple Moving Averages and Summary Numbers are for confluence and information.

Always remember to use the numbers as a guideline for potential areas of high probability plays.

Always use a set up based upon your system to enter a trade
.
Good trading all
 

Attachments

  • supportandresistance 06-01.jpg
    supportandresistance 06-01.jpg
    184.9 KB · Views: 191
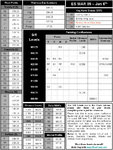
Hi everyone

Please find attached todays levels. The S/R numbers are in the black column, the MP, Pivots, Fibs, Simple Moving Averages and Summary Numbers are for confluence and information.

Always remember to use the numbers as a guideline for potential areas of high probability plays.

Always use a set up based upon your system to enter a trade
.
Good trading all
 

Attachments

  • supportandresistance 07-01.jpg
    supportandresistance 07-01.jpg
    183 KB · Views: 193
Top