You are using an out of date browser. It may not display this or other websites correctly.
You should upgrade or use an alternative browser.
You should upgrade or use an alternative browser.
I have found the Holy Grail indicator for the Dow Jones - 100% right so far
batsonar
Experienced member
- Messages
- 1,438
- Likes
- 126
Sorry but I failed to post a "BUY" signal yesterday the 23rd June 2022 from my indicator. As you can see the indicator has crossed the zero back into the "GREEN". This was a "BUY" signal and the DOW Jones is currently up 637 points to 31,314.

TEAMTRADER
Active member
- Messages
- 207
- Likes
- 86
I could have done with an up signal today....
TEAMTRADER
🙂
TEAMTRADER
🙂
batsonar
Experienced member
- Messages
- 1,438
- Likes
- 126
I failed to post a "SELL" signal yesterday Monday the 27th June 2022. As you can see the indicator crossed the zero line back into the "RED". This was a "SELL" signal and the DOW fell by 491 points today. I must get into the habit of posting all my signals. Sorry for the late post of signal.

Last edited:
batsonar
Experienced member
- Messages
- 1,438
- Likes
- 126
For Tuesday 28th June 2022. This is my MVMF indicator. As you can see the "Blue" line has crossed below the zero level and is reading -3.55. This is a "SELL" signal. This means that the DOW Jones could be about to make a move to the downside in the short to mid-term. This indicator has been quite accurate in back testing. Also the DOW has fallen below the "Pivot Point" support level of 31,045 (see pink line)

Last edited:
TEAMTRADER
Active member
- Messages
- 207
- Likes
- 86
Sadly I only got 75 of them 🙁
TEAMTRADER
TEAMTRADER
batsonar
Experienced member
- Messages
- 1,438
- Likes
- 126
This is my SMI Stochastics indicator. As you can see the "Blue" line has crossed the "Red" signal line. This is a "SELL" signal. This means that the DOW could be about to make a move to the downside in the short to mid-term. There is a "Pivot Point" resistance level at 31,235 (see blue line) so any upside could be limited.

sugarlandFX
Junior member
- Messages
- 19
- Likes
- 3
Batsonar you will have better luck running for president than trying to make folks believe in a nonsense indicator. The only holy grail if possible is the depth of market, the orders themselves...This is how you find trapped traders, exhaustion, absorption, etc. Trapped traders is one of the finest methods to trade, I make over $10,000 a day trading the index futures ES, YM, RTY, and NQ at 10 contracts minimum. Trust me, nothing gives you more patience, and a better reward to risk than the market depth. Plus, who trades on such a large timeframe, especially if we are talking about DAY TRADING...All you have here is another soupy indicator that tells the trader nothing. As traders we need INFORMATION like how many buy market orders to sell market orders, what price has the largest market order, which price has the largest limit orders, above AND below price. Which price has the most stacked/pulled orders...THIS IS INFORMATION TO TRADE VERY SUCCESSFULLY IN ANY MARKET!!!
.....
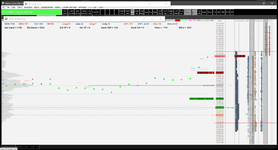
In the pic you will see information at the top, RAV, RBV, ASP, BSP, etc. These are the numbers from the DOM I programmed to show on my chart to analyze the orders the proper way. RAV is buy MARKET orders, not limit orders, and RBV is sell market orders. Market orders move price not limit orders and this is fact. We can see why I took this long for 25 contracts. There were much more buy market orders than sell market orders, and much more stacking by the bids. If there was a holy grail, then the depth of market is that by far.. We can see the total amount of market orders, this information alone blows away any indicator you could ever use...This information is the real time story of buyers and sellers doing what they do best, which is buying and selling. This tells the story of price direction.. Also to the right of price at 12570.75 you see the words CTBV Trap. This means at that price there was the biggest order on the order book which was a sell market order, that happened below current price. These are trapped traders at that price in the DOM, and you see what happened after that....No indicators on my screen, not even price bars on my screen, ALL YOU SEE ARE NUMBERS, because the numbers tell the story of buyers and sellers, which directly affects what price does..
.....
In the pic you will see information at the top, RAV, RBV, ASP, BSP, etc. These are the numbers from the DOM I programmed to show on my chart to analyze the orders the proper way. RAV is buy MARKET orders, not limit orders, and RBV is sell market orders. Market orders move price not limit orders and this is fact. We can see why I took this long for 25 contracts. There were much more buy market orders than sell market orders, and much more stacking by the bids. If there was a holy grail, then the depth of market is that by far.. We can see the total amount of market orders, this information alone blows away any indicator you could ever use...This information is the real time story of buyers and sellers doing what they do best, which is buying and selling. This tells the story of price direction.. Also to the right of price at 12570.75 you see the words CTBV Trap. This means at that price there was the biggest order on the order book which was a sell market order, that happened below current price. These are trapped traders at that price in the DOM, and you see what happened after that....No indicators on my screen, not even price bars on my screen, ALL YOU SEE ARE NUMBERS, because the numbers tell the story of buyers and sellers, which directly affects what price does..
Attachments
TEAMTRADER
Active member
- Messages
- 207
- Likes
- 86
I am sure that batsonar would encourage you to post your daily depth of market direction predictions for the YM and would join me in hoping you continue to enjoy success.Batsonar you will have better luck running for president than trying to make folks believe in a nonsense indicator. The only holy grail if possible is the depth of market, the orders themselves...This is how you find trapped traders, exhaustion, absorption, etc. Trapped traders is one of the finest methods to trade, I make over $10,000 a day trading the index futures ES, YM, RTY, and NQ at 10 contracts minimum. Trust me, nothing gives you more patience, and a better reward to risk than the market depth. Plus, who trades on such a large timeframe, especially if we are talking about DAY TRADING...All you have here is another soupy indicator that tells the trader nothing. As traders we need INFORMATION like how many buy market orders to sell market orders, what price has the largest market order, which price has the largest limit orders, above AND below price. Which price has the most stacked/pulled orders...THIS IS INFORMATION TO TRADE VERY SUCCESSFULLY IN ANY MARKET!!!
.....
In the pic you will see information at the top, RAV, RBV, ASP, BSP, etc. These are the numbers from the DOM I programmed to show on my chart to analyze the orders the proper way. RAV is buy MARKET orders, not limit orders, and RBV is sell market orders. Market orders move price not limit orders and this is fact. We can see why I took this long for 25 contracts. There were much more buy market orders than sell market orders, and much more stacking by the bids. If there was a holy grail, then the depth of market is that by far.. We can see the total amount of market orders, this information alone blows away any indicator you could ever use...This information is the real time story of buyers and sellers doing what they do best, which is buying and selling. This tells the story of price direction.. Also to the right of price at 12570.75 you see the words CTBV Trap. This means at that price there was the biggest order on the order book which was a sell market order, that happened below current price. These are trapped traders at that price in the DOM, and you see what happened after that....No indicators on my screen, not even price bars on my screen, ALL YOU SEE ARE NUMBERS, because the numbers tell the story of buyers and sellers, which directly affects what price does..
Good to have your take on the market.
I know one person in the UK that has used something similar to your method - he was a pro trader - and he turned £300 into over £1/3m within 18 months but day trading to that intensity has its health cost.
Thanks again sugarlandfx.
TEAMTRADER
sugarlandFX
Junior member
- Messages
- 19
- Likes
- 3
Welcome, thank you. Actually trading is only stressful if you are not educated and disciplined. Trading was meant to offer traders two things, financial freedom, and freedom of time. If trading is causing a person health issues I'd beg them to do something different..I am sure that batsonar would encourage you to post your daily depth of market direction predictions for the YM and would join me in hoping you continue to enjoy success.
Good to have your take on the market.
I know one person in the UK that has used something similar to your method - he was a pro trader - and he turned £300 into over £1/3m within 18 months but day trading to that intensity has its health cost.
Thanks again sugarlandfx.
TEAMTRADER
TEAMTRADER
Active member
- Messages
- 207
- Likes
- 86
He does - he retired at 50 and has more than enough to last for the rest of his life.
Everyone is different for everyone and trading professionally, that is for a living, is not for all.
This thread has been going for a while and as in all education - you know what you know and passing on knowledge is a bonus.
TEAMTRADER
PS
If I earned over $10,000 a day I'd give my grandson my lovely car!
Last edited:
Similar threads
- Replies
- 50
- Views
- 19K
- Replies
- 0
- Views
- 2K