You are using an out of date browser. It may not display this or other websites correctly.
You should upgrade or use an alternative browser.
You should upgrade or use an alternative browser.
I have found the Holy Grail indicator for the Dow Jones - 100% right so far
batsonar
Experienced member
- Messages
- 1,438
- Likes
- 126
This is my Force Index indicator. As you can see the indicator has crossed the zero line back into the "RED". This is a "SELL" signal on the DOW Jones. This means that the DOW could be about to make a move to the downside in the short to mid-term. However the downside could well be limited because as you can see on the chart there is a "Pivot Point" support level (blue line) at 34,209. Also the DOW is sitting on the 200 day moving average which should act as support.

do you have a video on how to use this indicator? the video at the beginning of the thread is goneThe "SELL" signal I gave yesterday turned out to be correct and the DOW Jones fell by 144 points today.
batsonar
Experienced member
- Messages
- 1,438
- Likes
- 126
Sorry but the video at the beginning of the thread wasn't relevant to my trading anymore. Unfortunately I don't do anymore videos of trading this indicator but might do in the future.do you have a video on how to use this indicator? the video at the beginning of the thread is gone
batsonar
Experienced member
- Messages
- 1,438
- Likes
- 126
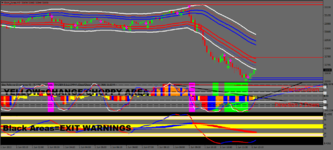
This is my Force Index indicator. As you can see the indicator has crossed the zero line back into the "GREEN". This is a "BUY" signal on the DOW Jones. This could mean that the DOW is about to make a move to the upside in the short to mid-term. As I thought it would do, the DOW bounced off the "Pivot Point" support level (blue line) of 34,209.

This is my Force Index indicator. As you can see the indicator has crossed the zero line back into the "GREEN". This is a "BUY" signal on the DOW Jones. This could mean that the DOW is about to make a move to the upside in the short to mid-term. As I thought it would do, the DOW bounced off the "Pivot Point" support level (blue line) of 34,209.
View attachment 316200
Did you take a trade at your pivot point? Also are those fibonnaci pivots, camirilla, or something else? Thank you for replying. So I am guessing this is the only thing you use now is the force indicator? Can you get this on thinkorswim or Ninjatrader?
batsonar
Experienced member
- Messages
- 1,438
- Likes
- 126
To be honest I don't do a lot of trading nowadays and if I do it is only through a practice account like Trading212. No I didn't trade the Pivot Point support level this time. Not sure what kind of Pivot Points they are. The Force Index is the main indicator I use although I do use quite a few more that basically do the same thing. It's the settings and parameters I use that make a difference on the indicators. Not sure if they are available on the thinkorswim or Ninjatrader platforms.Did you take a trade at your pivot point? Also are those fibonnaci pivots, camirilla, or something else? Thank you for replying. So I am guessing this is the only thing you use now is the force indicator? Can you get this on thinkorswim or Ninjatrader?
TEAMTRADER
Active member
- Messages
- 207
- Likes
- 86
batsonar
Experienced member
- Messages
- 1,438
- Likes
- 126
This is my Force Index indicator. As you can see the indicator has crossed the zero line back into the "GREEN". This is a "BUY" signal. This means that the DOW Jones could be about to make a move to the upside in the short to mid-term. Pivot Point support level is at 32,581 on the 3 month (1 day) bar chart.

Similar threads
- Replies
- 50
- Views
- 19K
- Replies
- 0
- Views
- 2K